
Market Context Before the 17/08 Session
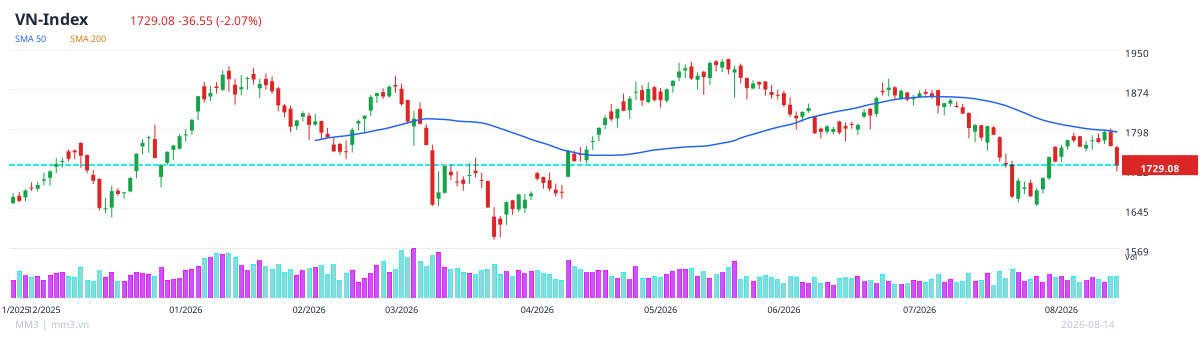
The market opens the week with a cautious sentiment, as the VN-Index stands at 1,729.1 points, down 2.1% in the most recent session. The HNXINDEX closed at 279.99 points, down 1.2%, while the UPCOMINDEX stood at 127.17 points, down 0.7%. The overall picture shows that defensive pressure still dominates and cash flow tends to be selective rather than broad-based.
This is consistent with the backdrop in which earlier technical rebounds have weakened. The 1,720-1,730 point zone of the VN-Index remains the nearby support to watch, while 1,750-1,775 points will be the first resistance zone for a recovery if the index sees a bounce.
International Market Signals and Overnight News
Overnight information still leans negative. Several reports point to the end of the technical rebound in the VN-Index and a rising risk of a return to the downtrend, while selling pressure in the banking, real estate and materials sectors remains a notable point.
- Cash flow trend: the technical rebound has ended, and the VN-Index risks "breaking below" the July bottom.
- The VN-Index fell short of the 1,800-point threshold, with the Vingroup group dragging the index down by nearly 39 points.
- Tracking big-money cash flow on 14/08: foreign investors continued to net sell, with FPT and the Vingroup group in focus.
- Vietnam stock market, Week of 10-14/08/2026: failed to break above the 1,800-point threshold.
- Market pulse 14/08: foreign investors continued to net sell, and the VN-Index evaporated more than 36 points.
- Another gloomy trading session for investors, with the VN-Index falling a further 36 points.
- Stock market blog: the "party" is over.
On the positive side, DXG remains a rare bright spot, rising nearly 6.0% in a session when the market was deep in the red, showing that some money is still seeking opportunities in individual stocks.
Notable Stock Groups
On HOSE, notable strong gainers include DDG +10.0%, SGH +9.6% and PPS +8.9%. Conversely, the deepest decliners include PHN -10.0%, ICG -9.9% and SFN -9.7%.
This divergence shows that the market has not yet produced a consensus recovery signal. Cash flow continues to favor individual stocks with their own stories, rather than lifting the index as a whole.
Liquidity and Cash Flow
HOSE liquidity remains concentrated in a few large-volume stocks. VIX led with 73.4M shares, followed by SHB with 47.5M and SSI with 34.0M.
High liquidity while the index declines shows that the market still has trading power, but cash flow is not yet strong enough to create a sustainable balance. This is typically accompanied by volatility and sharp divergence early in the session.
Technical Signals to Watch
The stocks with the highest composite scores currently lean toward several individual names, including VIM at 84.0, SJG at 83.6 and AIG at 83.4. These signals suggest that some stocks still maintain a positive technical structure even while the broader market is weak.
In terms of trend, many stocks on the technical watchlist still maintain an uptrend in EMA and a bullish MACD. This may allow short-term rebounds in individual stocks to emerge, although it is not enough to confirm a broad trend reversal.
HNX and UPCOM
| Index | Value | Change |
|---|---|---|
| HNXINDEX | 279.99 | -1.2% |
| UPCOMINDEX | 127.17 | -0.7% |
On HNX, notable gainers include DDG +10.0% and SGH +9.6%. On UPCOM, strong gainers include SAL +37.5% and ATA +33.3%, showing that there are still isolated hot spots outside the large-cap basket.
Outlook and Risks for the Morning Session
The base scenario is that the market opens the session in a cautious state, with weak momentum, and may retest the 1,720-1,730 point support zone of the VN-Index. If buying demand emerges strongly enough in a few leading stocks, the market could form a short technical rebound around the 1,750-1,775 point zone.
The main risk remains continued selling pressure in large-cap stocks, and foreign investor cash flow has not improved noticeably. In this context, divergence will remain the dominant trend, while a consensus recovery still requires additional confirming signals.
The data is for analytical and informational purposes only; it is not investment advice.