
Market before the 03/06 session: VN-Index retreats close to the 1,820-point support zone, downside pressure remains
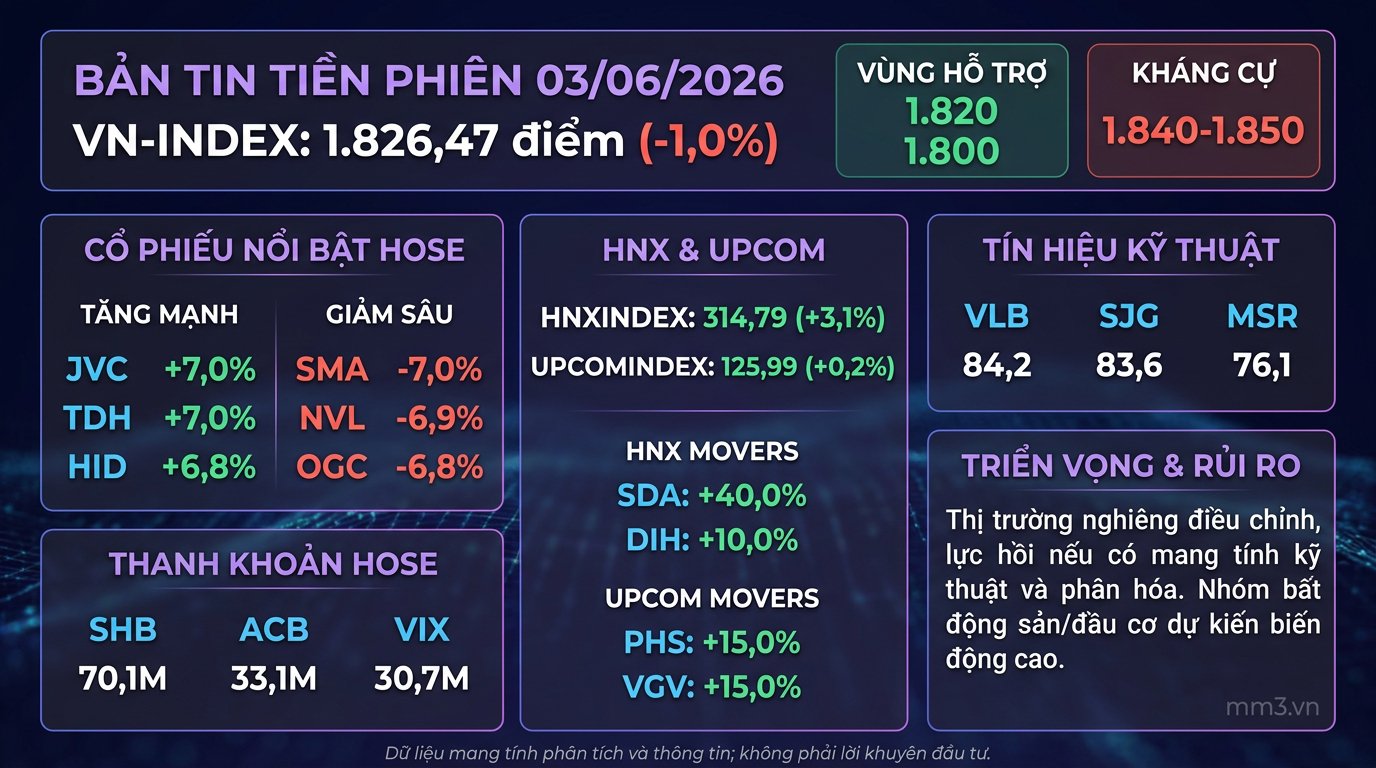
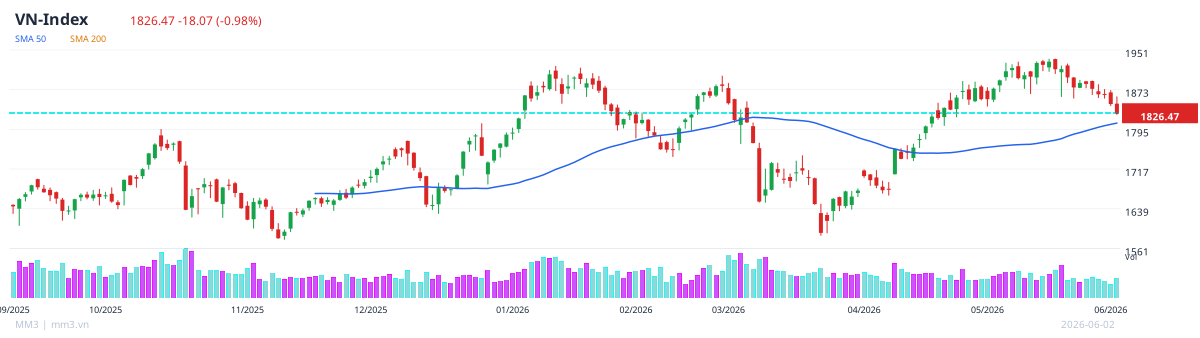
The previous session showed the market still leaning toward downside pressure, with VN-Index falling to 1,826.47 points, down 1.0%. The index is hovering near the support zone around 1,820 points, with 1,800 points further below. Meanwhile, the 1,840–1,850 point zone remains short-term resistance that must be broken to improve the recovery signal.
This movement comes as cash flow remains highly divided, particularly in speculative and land-bank stocks. On the other hand, some stocks with positive technical signals still hold relative appeal, although the overall market condition has not really improved.
Overview of the previous session
Widespread selling pressure on the HOSE continued to heighten cautious sentiment. OGC became the day's main negative highlight after falling to the daily limit, as news that its Tran Vu project was placed on the list of projects to be reclaimed weakened investor expectations regarding its land bank and the company's restructuring process.
In contrast, THD still showed the effect of speculative cash flow, as the stock surged sharply in a short period. However, this movement is highly divided and not enough to change the defensive posture of the broader market.
Notable stock groups
| Group | Ticker | Performance | Comment |
|---|---|---|---|
| Strong gainers | JVC | +7.0% | Attracting short-term buying interest |
| Strong gainers | TDH | +7.0% | Positive intraday movement |
| Strong gainers | HID | +6.8% | Maintaining a notable uptrend |
| Strong decliners | SMA | -7.0% | Very heavy selling pressure |
| Strong decliners | NVL | -6.9% | Deep decline still continuing |
| Strong decliners | OGC | -6.8% | Hit negatively by project-related news |
Liquidity and technical signals
Liquidity is concentrated in several large-cap stocks such as SHB, ACB, and VIX, showing that cash flow remains active but favors short-term trading. In terms of technical signals, many stocks are maintaining composite scores better than the market average.
| Ticker | Composite score | Status |
|---|---|---|
| VLB | 84.2 | Standout signal group |
| SJG | 83.6 | Standout signal group |
| MSR | 76.1 | Positive signal group |
| TVN | 75.2 | Positive signal group |
| FOC | 74.0 | Positive signal group |
| OCH | 75.6 | Positive signal group |
| PMS | 72.0 | Positive signal group |
| NST | 71.9 | Positive signal group |
| SHS | 71.1 | Positive signal group |
| PJC | 71.0 | Positive signal group |
| MIG | 72.9 | Positive signal group |
| VTO | 71.0 | Positive signal group |
| DHC | 70.8 | Positive signal group |
| TYA | 70.0 | Positive signal group |
| PNJ | 69.9 | Signal group to watch |
HNX and UPCOM
On the other two exchanges, the HNXIndex rose to 314.79 points, while the UPCOMIndex edged up 125.99 points. This divergence across exchanges remains fairly clear, even though the overall market trend has yet to shake off its cautious tone.
Among the leading stocks on each exchange, SDA gained 40.0% and DIH rose 10.0% on HNX; meanwhile, on UPCOM, PHS and VGV both climbed 15.0%. These are more localized signals than a change in the market's overall direction.
Short-term Outlook
- The 1,820-point zone is nearby support that warrants close monitoring; if this level breaks, the risk of retesting 1,800 points will increase.
- Resistance at 1,840–1,850 points remains the zone that must be overcome to improve market sentiment.
- Any rebound, if it occurs, is more likely to be technical and selective rather than broad-based.
In the short term, the market still needs further confirming signals from cash flow and market breadth. Investors should continue watching how the index reacts around the nearby support zone before expecting a more sustainable recovery.
This data is analytical and informational only; it does not constitute investment advice.