
Trading Session Overview
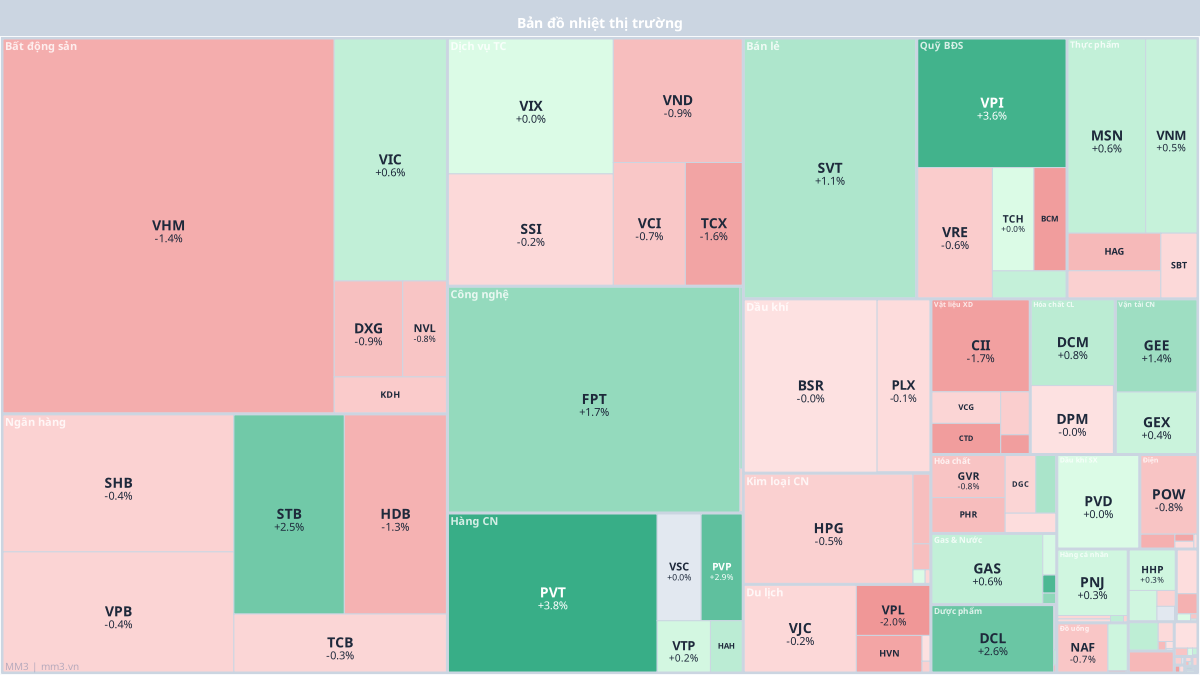
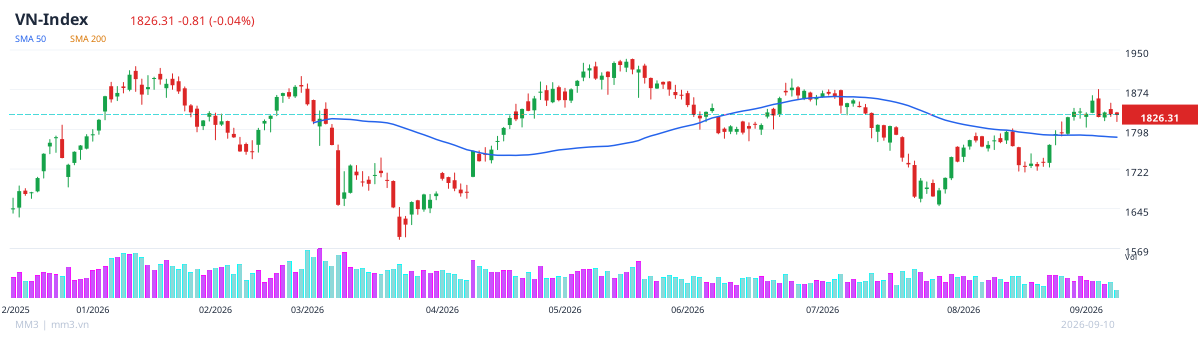
The mid-session market on September 10, 2026 recorded short-term equilibrium as VNINDEX stood at 1,826.31 points, down 0.04%, with trading volume of 235.7 million shares. Cash flow continued to rotate strongly across sectors, but market breadth showed a clear divergence.
Notable Stocks
Leading gainers on HOSE included DGW at +5.85%, VRC at +4.09%, and PVT at +3.81%. On the other side, stocks under heavy correction pressure included SRC at -5.81%, YBM at -5.76%, and SSC at -4.85%.
Liquidity was concentrated in SHB with 15.0 million shares, VHM with 9.7 million shares, and VIX with 9.1 million shares, indicating that cash flow still favors stocks with large trading volumes.
Sector Analysis
The retail sector stood out with a strong rally in DGW, while the industrial goods sector saw PVT maintain positive green momentum. In the banking sector, trading pressure remained high, with SHB being the most liquid stock on HOSE.
On HNX, the HNXINDEX fell 0.66% to 277.64 points. Strong gainers included DDG at +11.11% and PTD at +9.84%, while UNI at -10.00% and PJC at -9.52% were among the deep decliners. UPCOM also traded choppily as the UPCOMINDEX dropped 0.27% to 127.01 points, with DND at +15.00% and TTS at +14.55% leading the advance, while DDH at -40.00% and DLT at -36.05% faced heavy selling pressure.
Technical Signals
Among the notable technical signals, BTT achieved a composite score of 72.8, with both MACD and EMA tilting toward upward momentum. PVT scored 71.1 points, while BSI scored 68.6 points. These stocks are maintaining technical conditions that are more positive than the market as a whole.
| Ticker | Composite Score | Signal |
|---|---|---|
| BTT | 72.8 | RSI 48, neutral; MACD bullish; EMA bullish |
| PVT | 71.1 | RSI 60, neutral; MACD bullish; EMA bullish |
| BSI | 68.6 | RSI 57, neutral; MACD bullish; EMA bearish |
Outlook & Risks
Current developments suggest the market is trading within a narrow range, yet divergence across individual stock groups remains very high. The 1,820-point level continues to be a key support to watch closely, while the 1,830-point mark will be the next short-term psychological test.
The main risk lies in localized volatility swings as cash flow rapidly rotates between leading groups. In this context, it remains appropriate to monitor how cash flow reacts rather than focusing solely on movements in the broader index.