
Trading Session Overview
At midday on 04/11/2026, the VN-Index rose 13.0 points, or 0.8%, to 1,712.6 points on volume of 308.3 million shares. The HNX-Index gained 0.7% to 253.2 points, with volume of 26.1 million shares; the UPCOM-Index rose 0.3% to 122.5 points, with volume of 12.6 million shares. The data on advancing, declining and unchanged stock counts shows 0 across all three exchanges, so breadth cannot be derived from these fields.
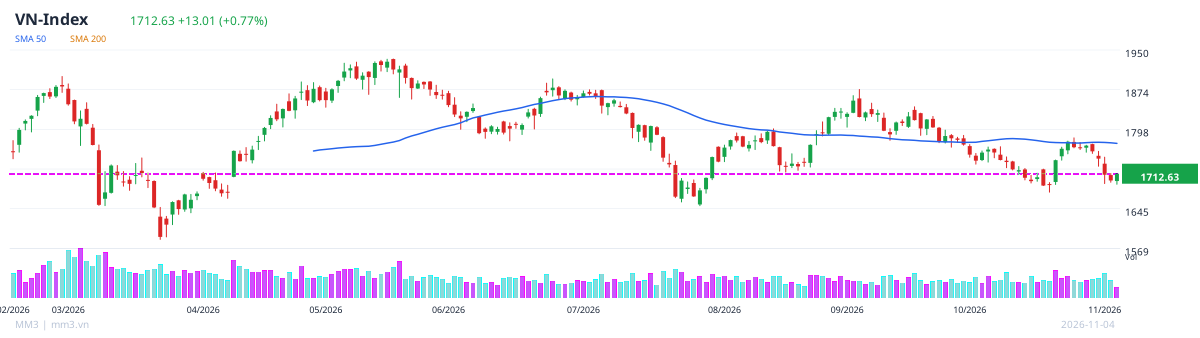
The VN30 rose 1.1% to 1,834.7 points, while the HNX30 gained 1.7% to 432.1 points. Although all indices moved higher, individual stock performance was clearly divergent: on HOSE, PIT rose 7.0% while TNC fell 7.0%; on UPCOM, VCR gained 15.0% while FTI dropped 32.4%.
Notable Stock Groups
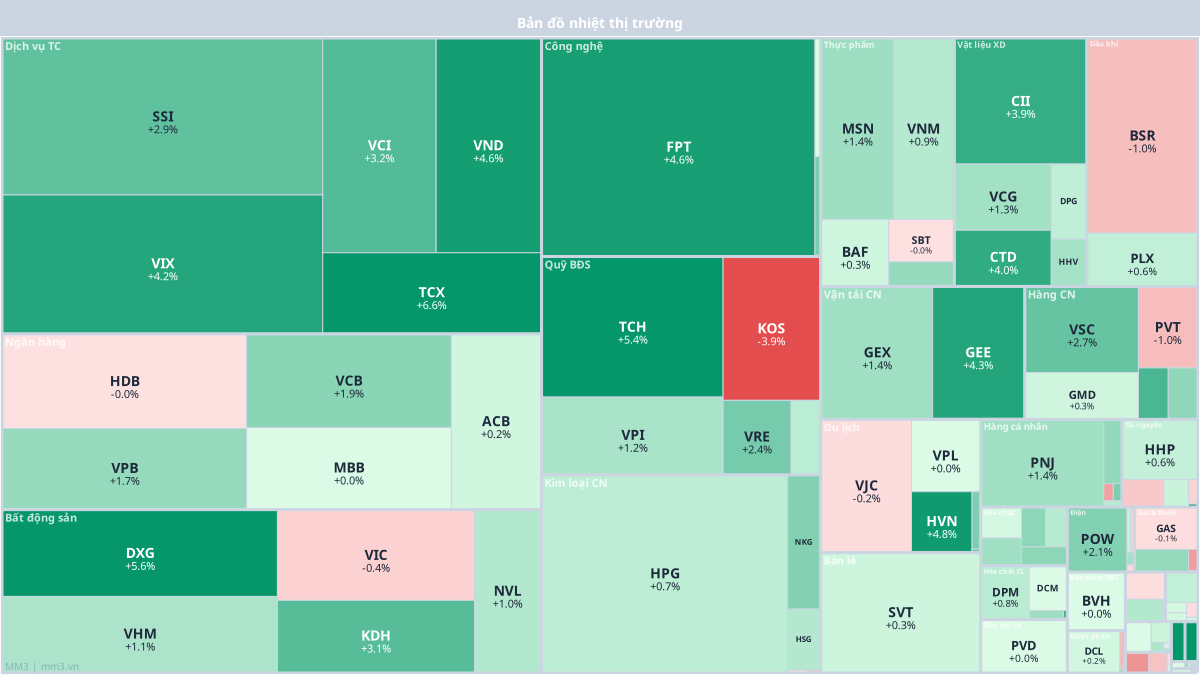
HOSE liquidity was concentrated in VIX, with 20.2 million shares, and KOS, with 20.1 million shares. Within the financial services group, VIX rose 4.2%, VND rose 4.6%, TCX rose 6.6% and SSI rose 2.9%.
On HNX, CEO led in volume with 7.1 million shares, followed by SHS with 7.0 million. CAR rose 10.0%, while PGS fell 10.0%. On UPCOM, OIL recorded the highest volume at 687,500 shares.
Some technical signals leaned toward an upward trend: BTT, DTT and FDC on HOSE showed rising MACD and EMA readings, with RSI at 58, 52 and 53 respectively. These are technical observations at the midday point; the data also shows RSI mostly in neutral territory and that signals across stocks are not yet aligned.
Sector Analysis
Financial services stocks on HOSE saw several gainers, including VND up 4.6%, TCX up 6.6%, VIX up 4.2% and VCI up 3.2%. Real estate was mixed: DXG rose 5.6% and KDH rose 3.1%, while VIC fell 0.4%.
In technology, FPT rose 4.6% and CMG rose 2.3%. In construction materials, CTD gained 4.0% and CII gained 3.9%, while in oil and gas, BSR fell 1.0%. The figures show varying degrees of divergence both across sectors and within individual groups.
Outlook
As of midday, the VN-Index, HNX-Index and UPCOM-Index were all higher, but the divergence among individual stocks remains noteworthy. Some MACD and EMA signals lean positive, yet RSI is largely in neutral territory and several EMA trends are not yet aligned. Therefore, the next move will depend on how cash flow spreads and on the performance of individual stock groups for the remainder of the session. The data provided does not identify support or resistance levels or upcoming events.
This data is analytical and informational, not investment advice. See the full report at app.mm3.vn