
Market Session Overview
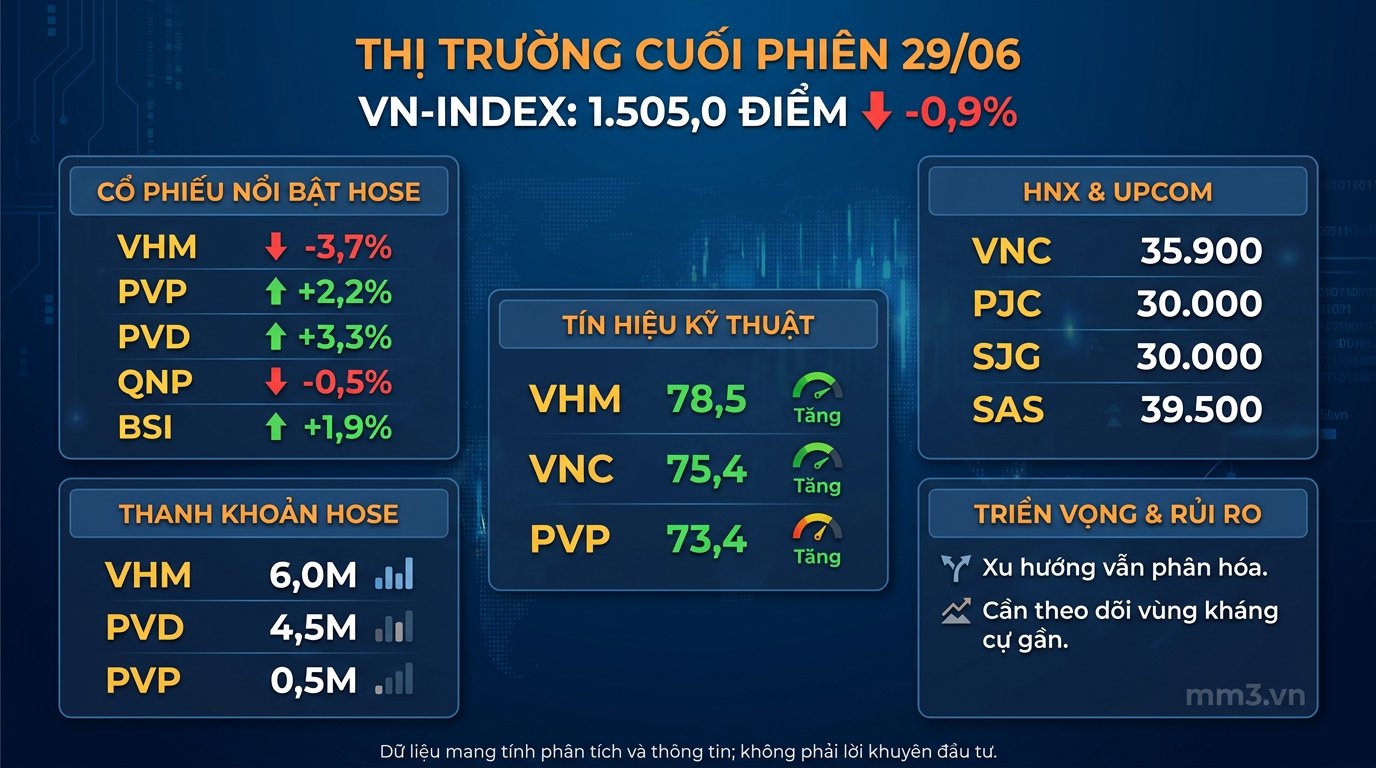
The trading session on June 29 closed with clearly divergent movements across the market. The VN-Index ended at 1,505.0 points, down 0.9%, indicating that correction pressure remains present even though many individual stocks continue to hold technical support.
The overall picture shows that capital flows continue to shift in a selective direction, favoring stocks with positive technical foundations or high composite scores. However, as the index retreats to its current level, short-term developments still need to be closely monitored around nearby support and resistance levels.
| Index | Value | Change |
|---|---|---|
| VN-Index | 1,505.0 points | -0.9% |
Notable Stock Group
Among the noteworthy stocks, VHM was the biggest decliner in the watchlist but still maintains a high position in composite score. On the other hand, PVD, PVP, and BSI all recorded positive gains, reflecting that buying demand is still emerging in some individual movements.
| Code | Price | Change | Volume | Composite Score | Support | Resistance |
|---|---|---|---|---|---|---|
| VHM | 150,300 | -3.7% | 6.0M | 78.5 | 148,700 | 153,600 |
| PVP | 18,500 | +2.2% | 509.7K | 73.4 | 17,600 | 18,700 |
| PVD | 32,650 | +3.3% | 4.5M | 73.2 | 32,600 | 32,750 |
| QNP | 32,300 | -0.5% | 1.1K | 72.4 | 31,700 | 32,400 |
| BSI | 34,900 | +1.9% | 550.3K | 72.4 | 34,850 | 36,000 |
| VNC | 35,900 | 0.0% | 26.0K | 75.4 | 35,400 | 36,600 |
| PJC | 30,000 | 0.0% | 0 | 73.4 | 29,000 | 30,442 |
| NBW | 37,000 | -3.9% | 4.1K | 70.2 | 32,000 | 41,201 |
| OCH | 7,500 | +1.4% | 29.4K | 69.6 | 7,100 | 8,000 |
| HMH | 17,800 | 0.0% | 0 | 69.4 | 17,000 | 18,000 |
| SJG | 30,000 | +9.5% | 400 | 81.6 | 24,000 | 30,300 |
| SAS | 39,500 | +1.3% | 11.7K | 76.9 | 37,800 | 40,000 |
| VLB | 49,400 | +1.2% | 15.6K | 76.2 | 48,600 | 49,500 |
| SDV | 32,500 | 0.0% | 0 | 76.0 | 31,900 | 32,700 |
| IST | 38,000 | -7.3% | 2.0K | 76.0 | 37,500 | 38,500 |
Analysis by Technical Signals
In terms of signal quality, VHM still leads the group by composite score with 78.5, while maintaining a positive technical structure as EMA, MACD, and PSAR all align on a bullish signal. VNC reached 75.4, while PVP stood at 73.4, indicating that there are still stocks with more stable trend foundations than the overall market.
- VHM: positive technical trend, but the price is approaching the resistance zone at 153,600.
- VNC: positive momentum with liquidity rising sharply, nearby resistance at 36,600.
- PVP: consensus signal, nearby resistance zone at 18,700.
- SJG: the strongest gainer in the watchlist, but it has come close to resistance at 30,300.
End-of-session outlook and levels to watch
In the short term, the market is likely to continue moving in a divergent state, with activity still driven by individual stocks showing strong technical signals. The nearby support and resistance levels of each stock will play a decisive role in the next price swings, especially for those that have approached key resistance thresholds.
For VHM, PVD, SJG, and VNC, price reactions at resistance zones will be the key detail to watch in the coming sessions. If buying demand holds steady, this group of stocks may continue to lead within each short-term move.
The information in this article is for analytical and reference purposes only and does not constitute investment advice.