
Trading Session Overview
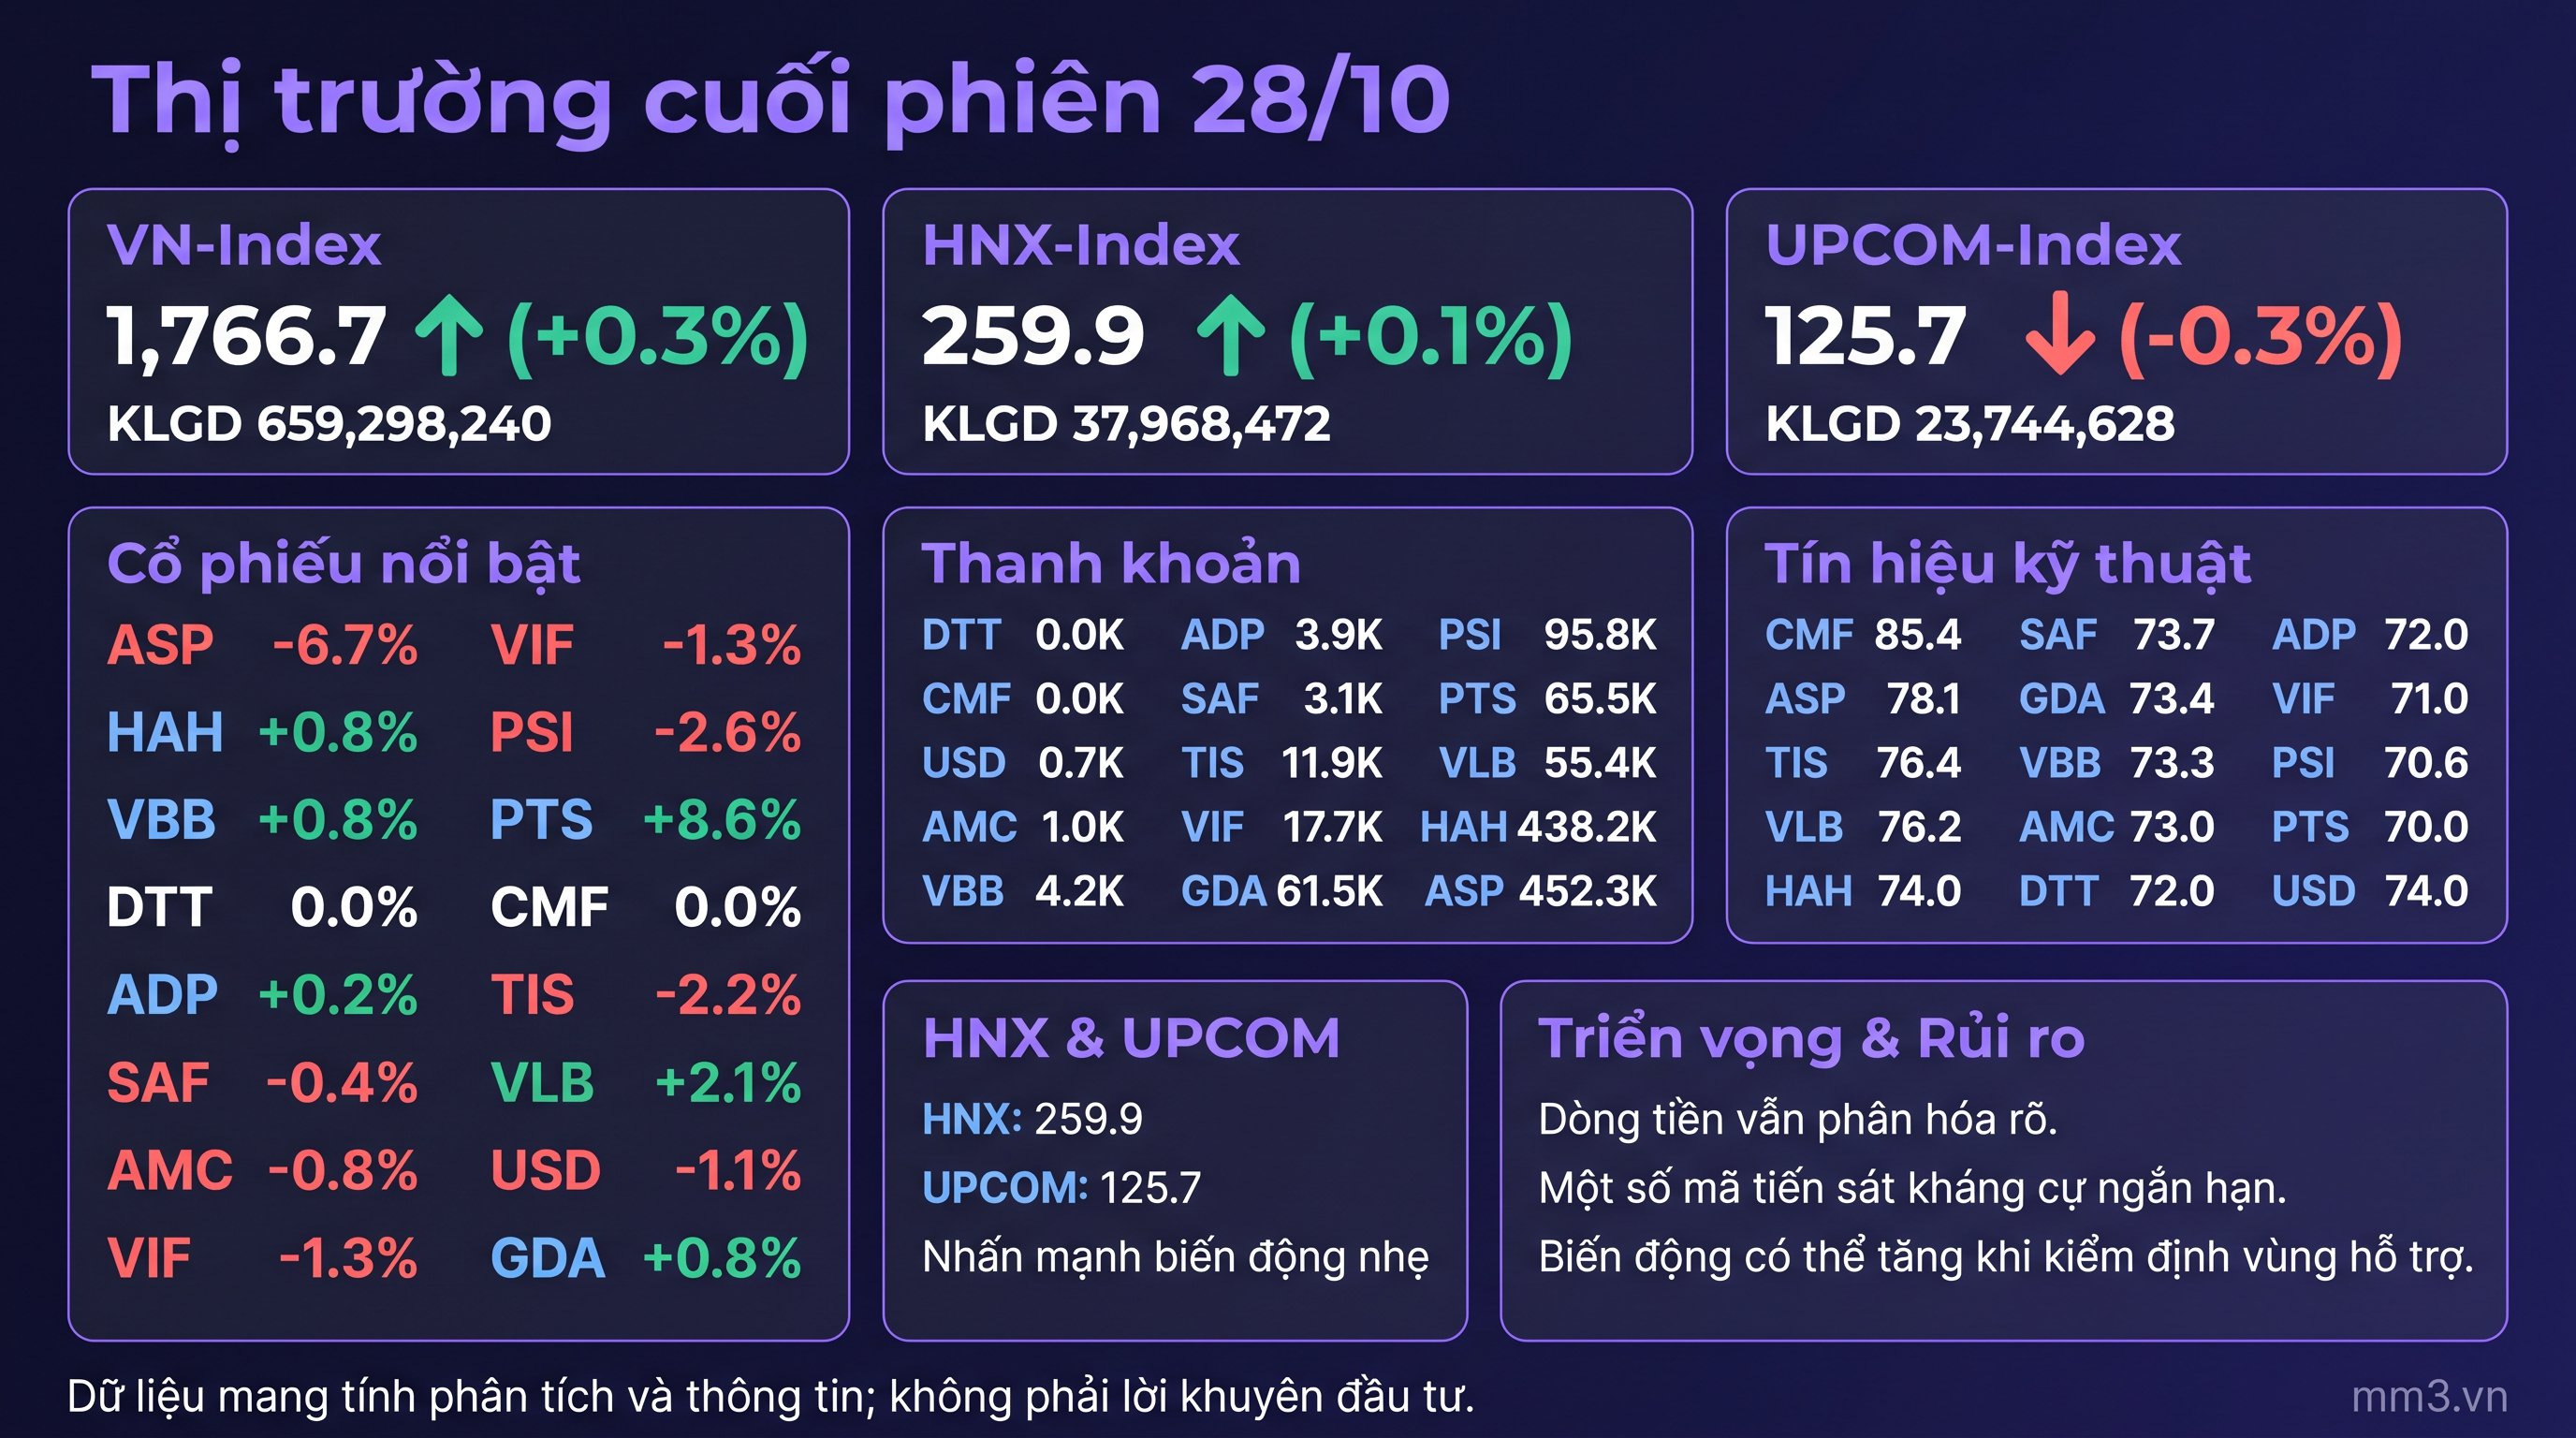
The October 28 trading session closed on a positive note across the key indices, with VNINDEX rising 4.78 points, or 0.2713%, to 1,766.65 points. Liquidity reached 659,298,240 units, showing that cash flow remained strong even as the market continued to diverge.
Among the other indices, HNXINDEX gained 0.36 points to 259.86 points, or 0.1387%, on trading volume of 37,968,472 units. In contrast, UPCOMINDEX fell 0.35 points to 125.74 points, or 0.2776%, with volume of 23,744,628 units.
| Index | Points | Change | % | Volume |
|---|---|---|---|---|
| VNINDEX | 1,766.65 | +4.78 | +0.2713% | 659,298,240 |
| HNXINDEX | 259.86 | +0.36 | +0.1387% | 37,968,472 |
| UPCOMINDEX | 125.74 | -0.35 | -0.2776% | 23,744,628 |
Notable Stocks
Price movements during the session showed a clear divide between stocks with strong buying demand and those under pressure to correct. The most notable was PTS, which rose 8.5714% on volume of 65,500 units, while ASP dropped sharply by 6.7073% on volume of 452,300 units.
- Notable gainers: PTS +8.5714%, VLB +2.0913%, HAH +0.7968%, GDA +0.8264%, VBB +0.8%, ADP +0.2083%.
- Notable decliners: ASP -6.7073%, PSI -2.5974%, TIS -2.1739%, VIF -1.25%, USD -1.1364%, AMC -0.7634%, SAF -0.3521%.
Stocks that traded flat included DTT and CMF, both with 0% change, reflecting a wait-and-see stance from investors at certain price levels.
Sector Analysis
The current data does not show a fully unified picture across sectors, but stocks with high composite scores still maintain fairly solid technical foundations. The leaders by composite score were CMF at 85.4, ASP at 78.127525, TIS at 76.4, VLB at 76.244446, and HAH at 74.00261.
On the other side, stocks such as PSI at 70.575, PTS at 70.00261, and VIF at 71.02288 still recorded wider fluctuations, suggesting profit-taking pressure or caution around near-term resistance zones.
| Ticker | Price | Support | Resistance | Composite Score |
|---|---|---|---|---|
| CMF | 389,000 | 388,800 | 394,000 | 85.4 |
| ASP | 15,300 | 15,100 | 15,950 | 78.127525 |
| TIS | 4,500 | 4,400 | 4,600 | 76.4 |
| VLB | 53,700 | 48,000 | 0 | 76.244446 |
| HAH | 50,600 | 50,500 | 53,200 | 74.00261 |
HNX and UPCOM
On the other two exchanges, HNXINDEX continued to edge higher while UPCOMINDEX corrected slightly. This suggests that money flow is still seeking opportunities but has not spread evenly across stock groups.
From a technical perspective, the support and resistance levels for each stock remain key anchors for near-term price action. For PTS, the 9,500 zone is the nearest reference level; for ASP, the 15,100 and 15,950 levels are the two main levels to watch.
Outlook & Risks
The general trend still leans toward a positive state, but the sustainability of the upward momentum will depend on the ability to hold nearby support zones and on improvements in liquidity among leading stocks. Some stocks have advanced close to short-term resistance, raising the likelihood of volatility in the coming sessions.
In the short term, investors should monitor how VNINDEX reacts around the current index level, along with price movements in stocks with high composite scores such as CMF, ASP, TIS, and VLB.