
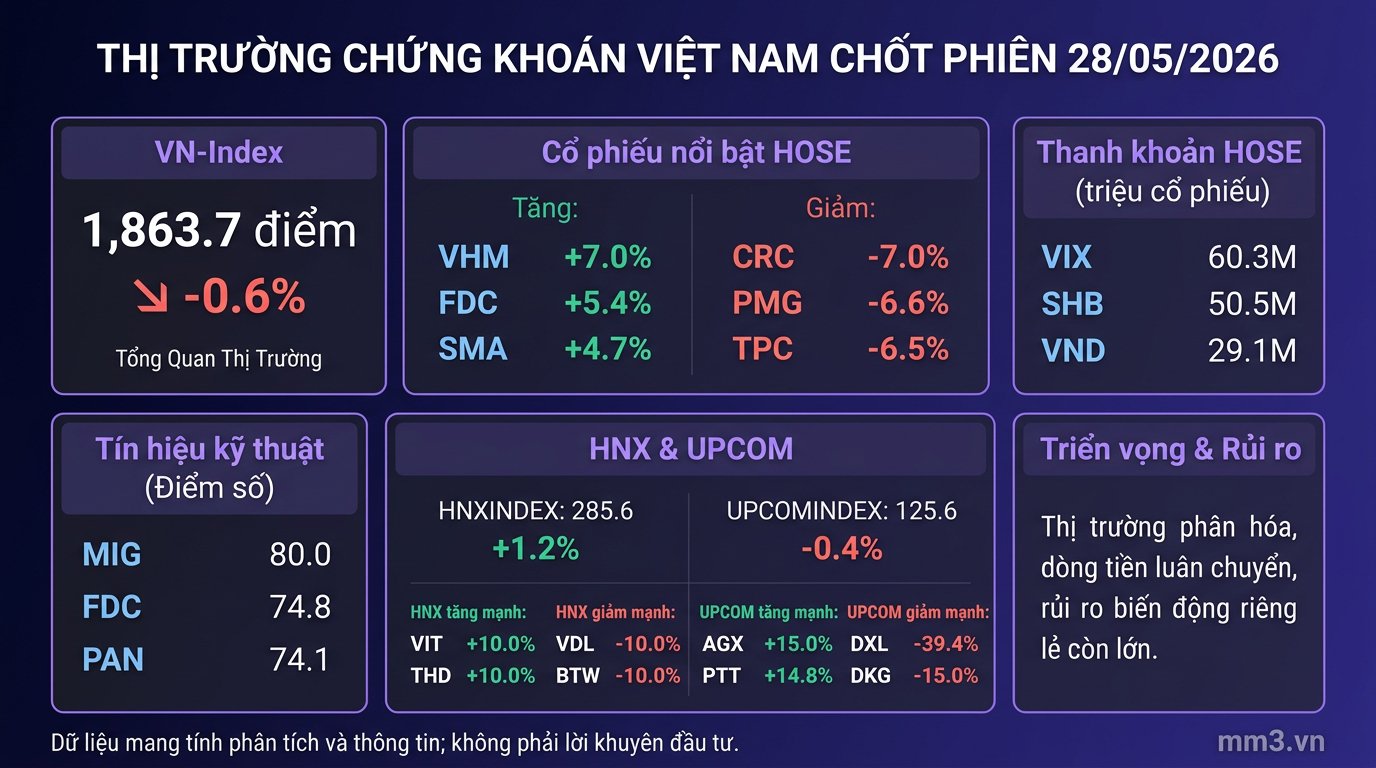
Trading Session Overview
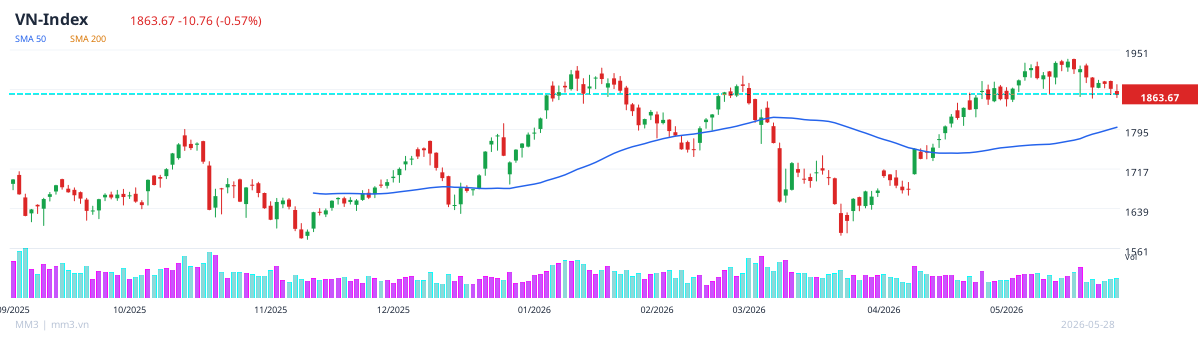
The May 28 session closed with clearly divergent movements across the market. The VN-Index fell 0.6% to 1,863.7 points, while the HNX-Index rose 1.2% to 285.6 points and the UPCOM-Index dropped 0.4% to 125.6 points. Liquidity remained elevated in many large-cap stocks, showing that money flow was still active but had not formed a consensus trend across the broader market.
On HOSE, large-liquidity stocks continued to lead trading activity. VIX matched 60.3 million shares, SHB reached 50.5 million shares, and VND reached 29.1 million shares, reflecting a concentration of money flow into stocks with short-term leading roles.
Notably, strong gainers appeared alongside profit-taking pressure in many other stocks, causing price levels to fluctuate sharply across sectors and individual tickers.
| Ticker | Price | Change | Liquidity |
|---|---|---|---|
| VHM | 157,700 | +7.0% | 8.9 million shares |
| FDC | 23,350 | +5.4% | 25.1 thousand shares |
| SMA | 10,450 | +4.7% | 100 shares |
| CRC | 6,670 | -7.0% | 3.5 million shares |
| PMG | 6,530 | -6.6% | 200 shares |
| TPC | 8,230 | -6.5% | 800 shares |
Notable Stock Groups
The real estate sector was the focal point, with VHM up 7.0%, while VIC was flat, PDR fell 2.9%, DXG dropped 0.4%, and NVL declined 2.3%. This movement suggests money flow remained highly selective, concentrating on a few individual stocks rather than spreading across the entire sector.
In the financial services group, VIX fell 4.1% but remained the most liquid stock on HOSE, while VND rose 0.3%. The divergence between price action and liquidity reflects intense tension between supply and demand.
| Ticker | Sector | Price | Change | Liquidity |
|---|---|---|---|---|
| VHM | Real Estate | 157,700 | +7.0% | VND 1,406.4 billion |
| VIX | Financial Services | 17,600 | -4.1% | VND 1,061.3 billion |
| SHB | Banking | 13,800 | -1.4% | VND 696.5 billion |
| MSB | Banking | 15,100 | +0.7% | VND 435.1 billion |
| HPG | Industrial Metals | 24,000 | -0.6% | VND 376.0 billion |
Sector Analysis
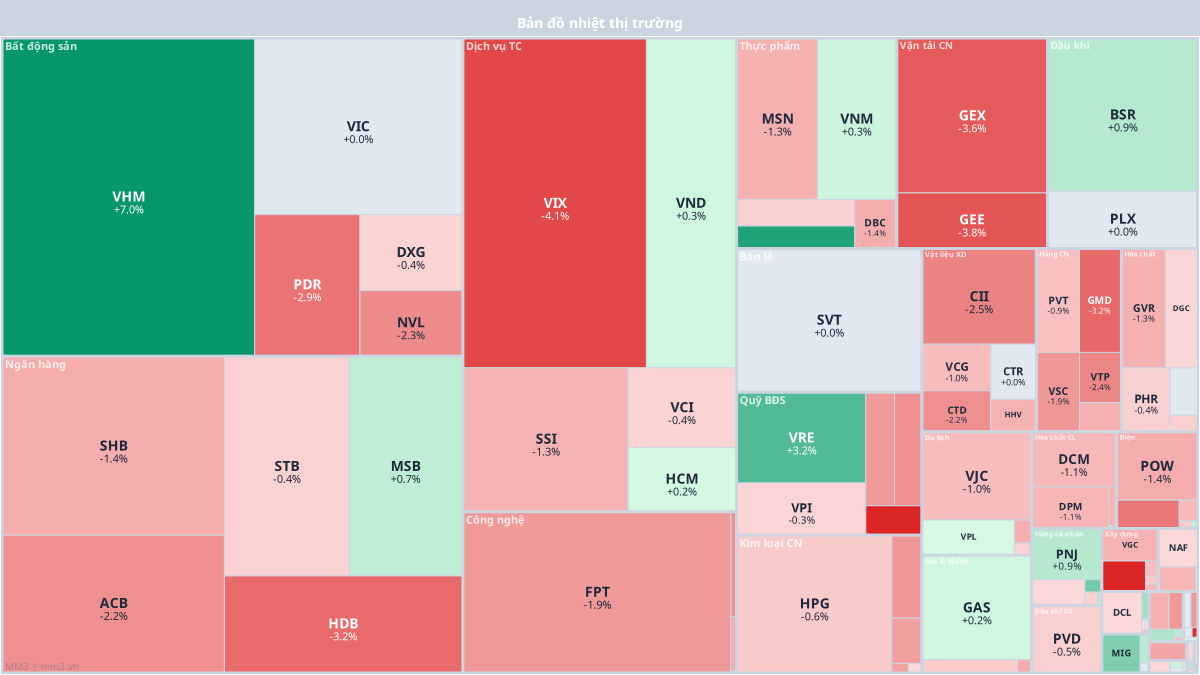
In real estate, divergence was clear as VHM hit the ceiling price, rising nearly 7.0%, while many other stocks such as PDR, DXG, and NVL continued to decline. This indicates that the current recovery is more localized than sector-wide.
The banking group continued to trade actively, with SHB matching 50.5 million shares, ACB down 2.2%, STB down 0.4%, MSB up 0.7%, and HDB down 3.2%. Money flow tended to favor highly liquid stocks, yet correction pressure remained present across most banking shares.
In financial services, VIX and VND were the two most notable stocks in terms of liquidity. Meanwhile, consumer, technology, transportation, construction, and retail sectors all recorded predominantly red trading, contributing to the broader weakening of the index.
Notable Technical Signals
- MIG: composite score 80.0, RSI 58, MACD bullish, mixed EMA.
- FDC: composite score 74.8, RSI 56, MACD bullish, bullish EMA.
- PAN: composite score 74.1, RSI 52, MACD bullish, bullish EMA.
- VND: composite score 73.5, RSI 65, MACD bullish, mixed EMA.
- CTR: composite score 72.2, RSI 61, MACD bullish, mixed EMA.
HNX and UPCOM: capital rotates into small and mid-cap stocks
On HNX, the HNX-Index rose 1.2% to 285.6 points, suggesting that the short-term recovery signal remains intact. Liquidity was concentrated in SHS with 16.8 million shares, followed by CEO with 6.4 million shares and MBS with 3.3 million shares.
Among the strong gainers on HNX, VIT and THD both rose 10.0%, while VDL and BTW both fell 10.0%. On UPCOM, AGX gained 15.0% and PTT gained 14.8%, while DXL dropped 39.4% and DKG dropped 15.0%, showing how wide the individual price swings have been.
| Exchange | Index | Change | Top Gainers | Top Losers |
|---|---|---|---|---|
| HNX | 285.6 | +1.2% | VIT, THD | VDL, BTW |
| UPCOM | 125.6 | -0.4% | AGX, PTT | DXL, DKG |
Outlook and risks
In the short term, the 1,860-point zone on the VN-Index is a level to watch closely, while the 1,870-point area is a notable recovery zone if capital returns to the leading stocks. Conversely, if profit-taking pressure continues in large-cap stocks, the market may keep trading in a highly divergent state.
The main risk at present is the mismatch between liquidity and the index trend: capital flows remain large but are not strong enough to create broad-based consensus. In this context, investors should watch the key price levels of each industry group and how high-liquidity stocks react in the coming sessions.