
Market Session Overview
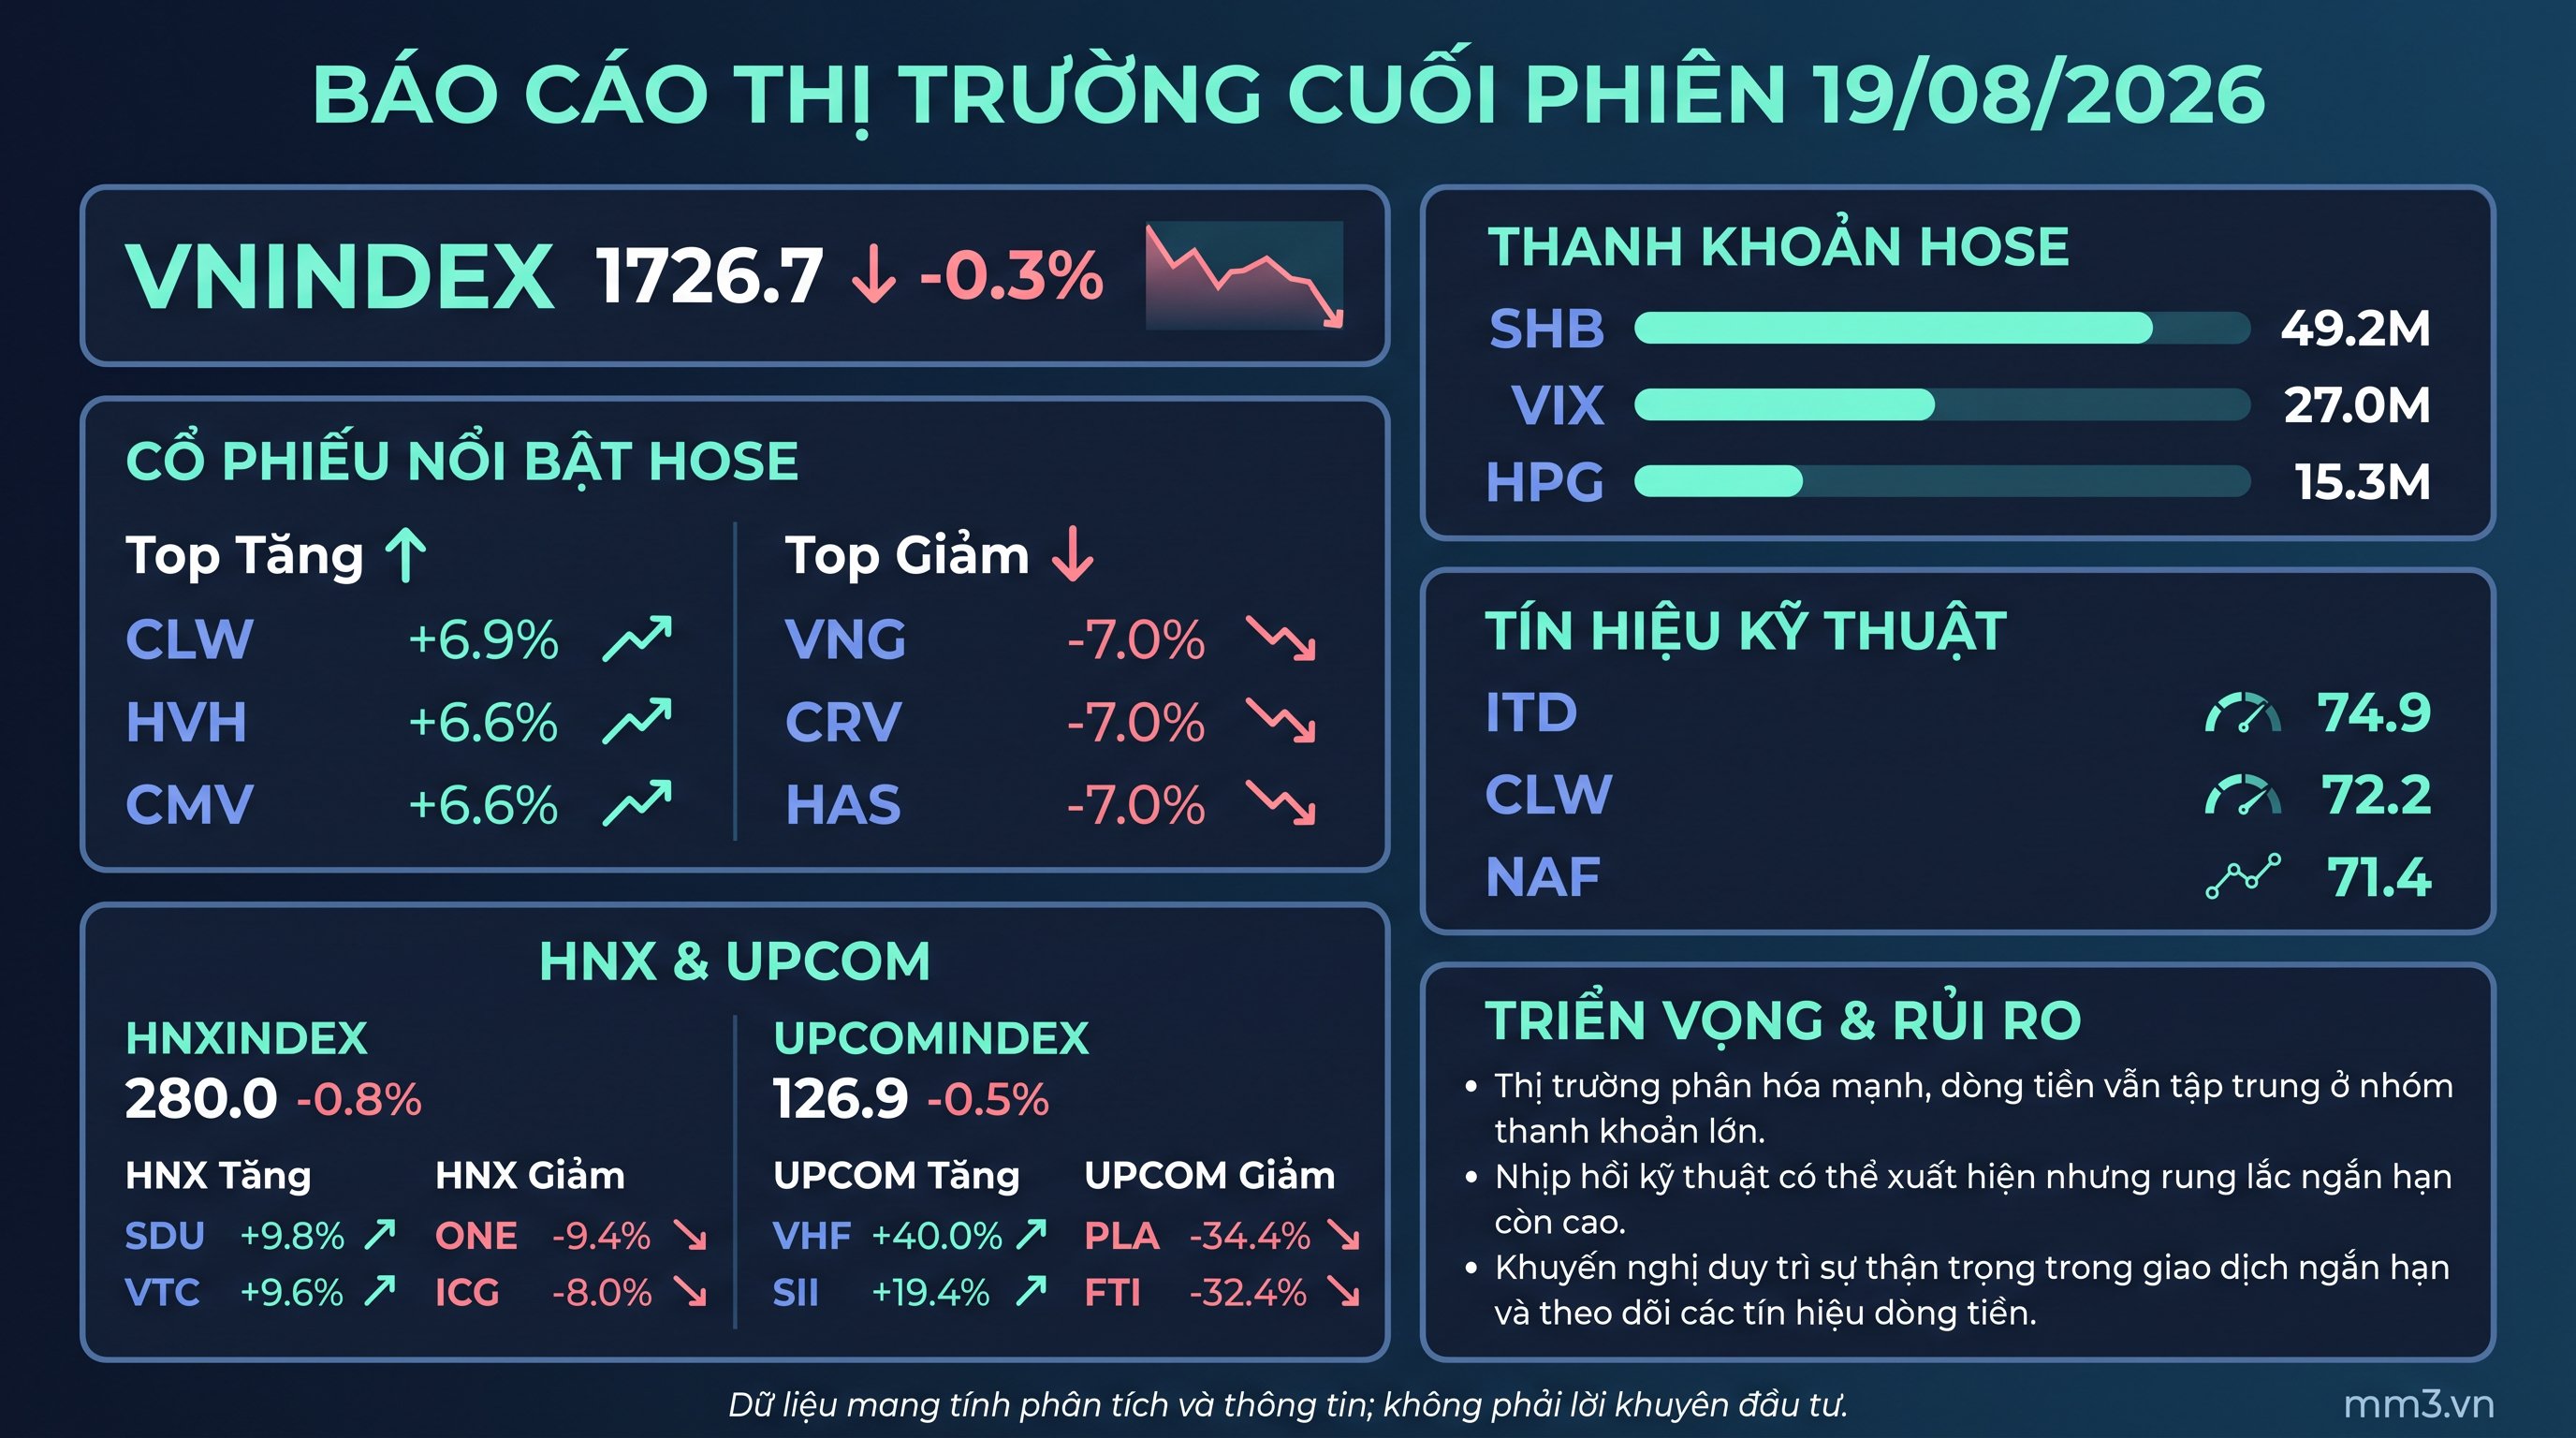
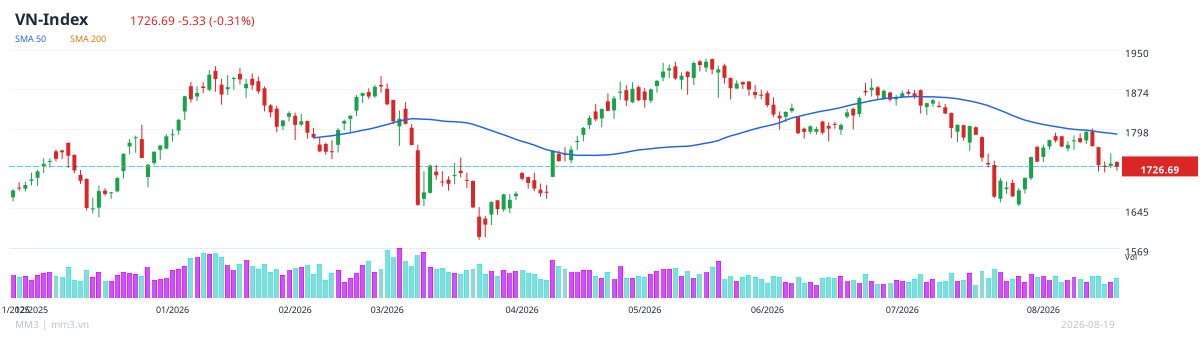
At the close of the August 19, 2026 session, the market recorded a slight correction across all three exchanges. The VN-Index closed at 1,726.7 points, down 0.3%. Overall market liquidity remained high, but divergence increased noticeably as capital concentrated in a number of large-cap stocks and groups with surging liquidity.
The overall picture shows that buying demand has not withdrawn from the market, yet profit-taking pressure has emerged in many overheated stock groups. As a result, the index decline was not deep, but intraday volatility remained relatively wide, reflecting investors' cautious sentiment as the market trades near elevated levels.
Key Index Performance
| Index | Points | Change |
|---|---|---|
| VNINDEX | 1,726.7 | -0.3% |
| HNXINDEX | 280.0 | -0.8% |
| UPCOMINDEX | 126.9 | -0.5% |
Notable Stock Groups
On HOSE, the leading gainers of the session were CLW (+6.9%), HVH (+6.6%), and CMV (+6.6%). Conversely, the stocks under the heaviest selling pressure were VNG (-7.0%), CRV (-7.0%), and HAS (-7.0%).
Notably, the divergence among prominent stock groups suggests the market no longer moves in a uniform uptrend. Instead, capital is selectively flowing into individual stocks with compelling narratives or favorable technical factors.
Liquidity and Capital Flows
The top stocks by trading volume on HOSE continued to be SHB with 49.2 million shares, followed by VIX with 27.0 million shares and HPG with 15.3 million shares. All of these stocks attracted substantial capital during the session, helping sustain overall market trading activity.
The concentration of liquidity in a handful of blue-chip stocks indicates that capital remains present but is becoming more selective. This typically goes hand in hand with stock-by-stock divergence rather than broad-based market movement.
Notable Technical Signals
Among technical signals, ITD achieved a composite score of 74.9, topping the watchlist. Following it were CLW with 72.2 points and NAF with 71.4 points. These stocks are showing relatively positive technical conditions compared with the broader market.
These signals suggest that the likelihood of a technical rebound remains, particularly in stocks that corrected earlier. However, investors should keep in mind that the broader market has not yet escaped its short-term volatility.
Sector Analysis
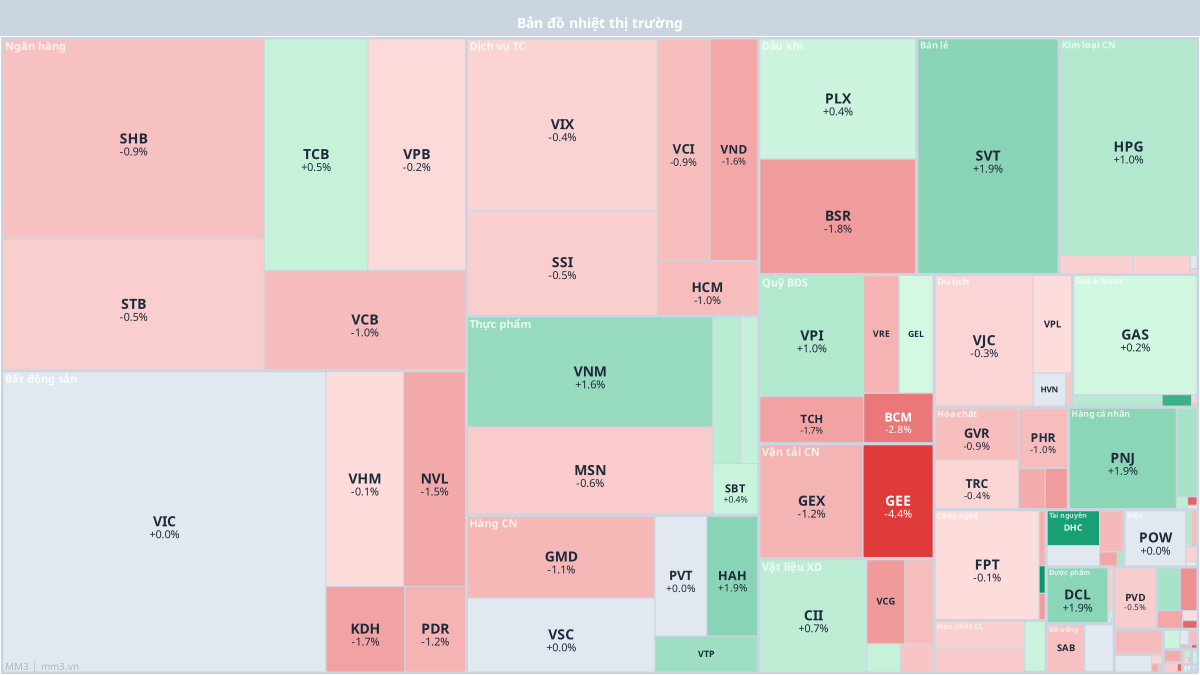
In banking, real estate, financial services, and other high-liquidity sectors, performance was generally not strong enough to push the index back up. Capital continues to rotate between sectors, while many mid- and small-cap stocks experienced considerably wider price swings than the index.
A notable feature of the session was the simultaneous appearance of strong gainers and deep decliners on both HNX and UPCOM. This clearly reflects highly selective stock picking rather than a unified market trend.
| Exchange | Top Gainers | Top Losers |
|---|---|---|
| HNX | SDU (+9.8%), VTC (+9.6%), PTX (+9.3%) | ONE (-9.4%), ICG (-8.0%), AMV (-7.7%) |
| UPCOM | VHF (+40.0%), SII (+19.4%), TTG (+14.9%) | PLA (-34.4%), FTI (-32.4%), HBD (-14.9%) |
Outlook and Risks
In the short term, the VN-Index is likely to continue fluctuating around the 1,700-point level, with volatility interspersed with technical rebound phases. The 1,730-point zone is a notable area, as selling pressure may return, while the nearby support zone remains important for sustaining the market's momentum.
The main risk lies in excessive divergence: cash flow may continue to concentrate in a few individual stocks, while the rest lack the momentum for a breakout. If liquidity does not improve more evenly, the market's upward momentum will be difficult to sustain.
General view: the market still maintains good liquidity, but the current state leans toward stock selection rather than an expansion of the uptrend. Investors should closely monitor the index's reaction at nearby resistance zones and the extent to which cash flow spreads in the coming sessions.