
Trading Session Overview
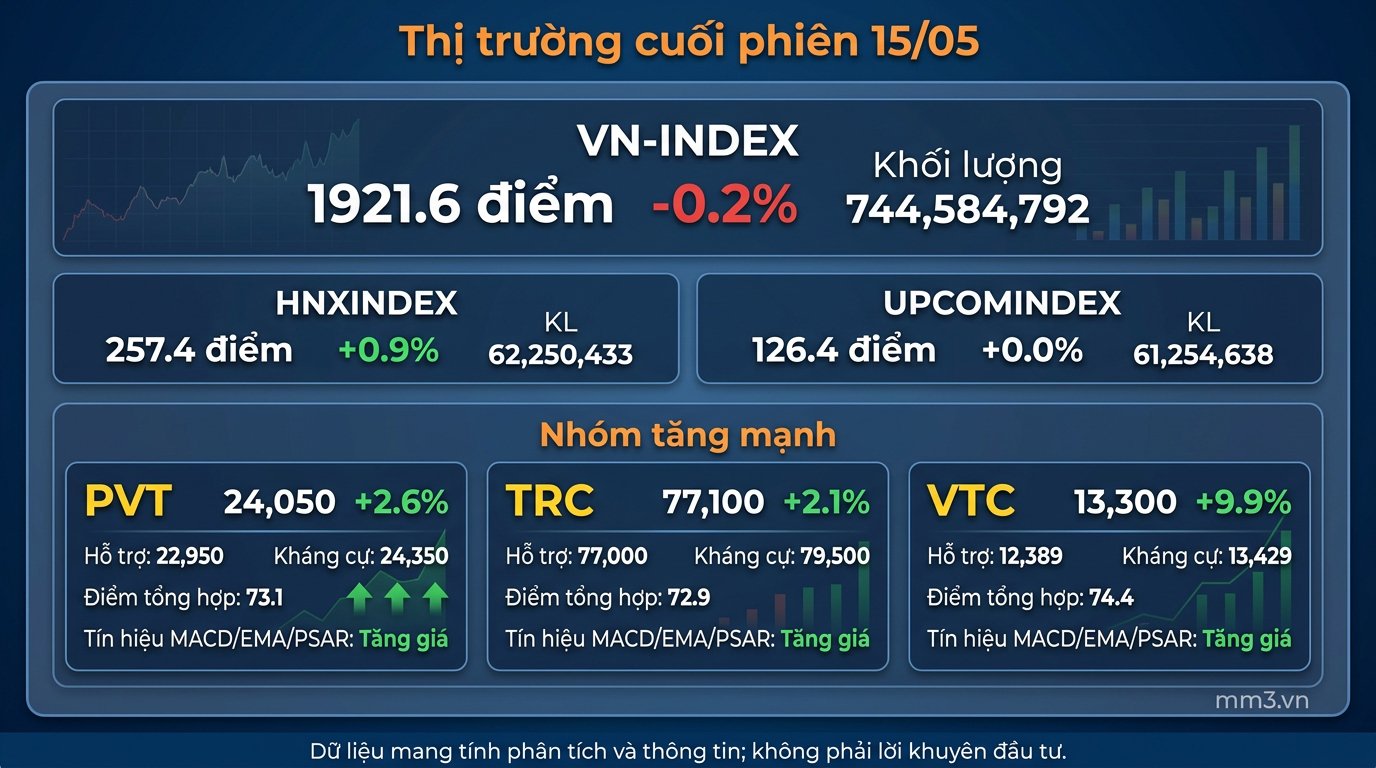
The May 15 trading session closed with mixed performance across the major indices. VNINDEX ended at 1921.6 points, down 0.2%, with a trading volume of 744,584,792 units, indicating that profit-taking pressure remains present among large-cap stocks.
In contrast, HNXINDEX rose 0.9% to 257.4 points on a volume of 62,250,433 units, while UPCOMINDEX was flat around 126.4 points, recording a volume of 61,254,638 units. This movement reflects a generally positive overall picture, but the sustainability of the upward momentum will need further confirmation from cash flow and liquidity.
Market Breadth and Conditions
The overall outlook remains positive, as most stocks on the list maintain favorable technical structures. However, the market has not yet shown a breakout signal strong enough to firmly confirm a new uptrend.
- Stocks with strong momentum continue to attract attention.
- Some stocks with strong gains are accompanied by improved liquidity, reinforcing short-term recovery signals.
- Divergence persists among stocks whose technical conditions are not yet fully aligned.
Notable Stocks
Among the leading names, PVT, TRC, VTC, RTB, and HDP all recorded positive price trends, with many accompanied by significantly improved liquidity. This suggests that cash flow continues to flow into stocks with solid technical foundations.
PVT rose to 24,050 VND, up 2.6%, with trading volume at 1.3 times the average. The technical structure is aligned, as MACD, EMA, and PSAR all lean bullish; nearby support is at 22,950 VND and resistance at 24,350 VND.
TRC gained 2.1% to 77,100 VND, with trading volume rising to 2.2 times the average. The stock is approaching resistance at 79,500 VND, while nearby support lies at 77,000 VND.
VTC stood out the most among gainers, breaking out 9.9% to 13,300 VND, with trading volume at 1.9 times the average. The support level at 12,389 VND and resistance at 13,429 VND are two key levels to watch in the coming sessions.
RTB rose 2.4% to 30,200 VND, accompanied by volume 3.4 times the average. It is one of the stocks with the highest technical scores, at 100 technical points and a composite score of 76.0; support is at 28,600 VND and resistance at 30,300 VND.
HDP surged 11.8% to 27,500 VND, with volume reaching 3.3 times the average. The stock is nearing resistance at 28,700 VND after breaking above support at 26,000 VND.
Stocks to Watch
Alongside the positive signals, some stocks showed signs of correction or divergence, reflecting volatility around key price levels.
KSV fell 4.1% to 157,300 VND, although its composite score remained at 75.7. Nearby support is at 157,100 VND and resistance at 162,000 VND, indicating that the stock is at a fairly sensitive short-term equilibrium zone.
MSR dropped 4.6% to 39,600 VND, although its composite score still reached 78.1. The support zone at 36,800 VND and resistance at 42,300 VND will be the two levels that determine the next phase of this correction.
SJG was flat around 21,000 VND, as MACD turned negative while EMA and PSAR remained positive. Nearby support is at 20,500 VND and resistance at 21,400 VND.
Additionally, DHC slipped 0.5% to 36,200 VND despite a technical score still at 95; BTT was flat at 40,800 VND with a composite score of 73.5; HDB fell 0.9% to 27,550 VND; PVI declined 0.9% to 79,300 VND amid divergent EMA conditions; SAF rose 4.7% to 56,000 VND; and IDP gained 5.3% to 295,600 VND with a positive technical trend.
Representative Stock Table
| Code | Price | % Change | Composite Score | Signal | Support | Resistance |
|---|---|---|---|---|---|---|
| PVT | 24,050 | +2.6% | 73.1 | MACD/EMA/PSAR bullish | 22,950 | 24,350 |
| TRC | 77,100 | +2.1% | 72.9 | Improving liquidity | 77,000 | 79,500 |
| VTC | 13,300 | +9.9% | 74.4 | Strong upward momentum | 12,389 | 13,429 |
| RTB | 30,200 | +2.4% | 76.0 | Technical score 100 | 28,600 | 30,300 |
| HDP | 27,500 | +11.8% | 74.0 | High liquidity | 26,000 | 28,700 |
| KSV | 157,300 | -4.1% | 75.7 | Short-term correction | 157,100 | 162,000 |
| MSR | 39,600 | -4.6% | 78.1 | Profit-taking pressure | 36,800 | 42,300 |
| SJG | 21,000 | 0.0% | 73.6 | MACD bearish, EMA/PSAR bullish | 20,500 | 21,400 |
| DHC | 36,200 | -0.5% | 73.7 | Good technical trend | 36,050 | 36,800 |
| BTT | 40,800 | 0.0% | 73.5 | Sideways accumulation | 38,923 | 49,000 |
| HDB | 27,550 | -0.9% | 72.7 | Fluctuating near resistance | 27,250 | 27,800 |
| PVI | 79,300 | -0.9% | 73.4 | Divergent EMA | 77,200 | 81,000 |
| SAF | 56,000 | +4.7% | 72.5 | Positive recovery | 53,100 | 57,000 |
| IDP | 295,600 | +5.3% | 75.6 | Uptrend maintained | 252,000 |
Outlook
In the short term, the overall backdrop still leans toward a positive trend, but VNINDEX has not yet received sufficient confirmation from cash flow and liquidity to consolidate a sustainable upward move. As a result, the market is likely to continue to diverge, with individual stock groups following their own technical foundations.
With HNXINDEX and UPCOMINDEX maintaining better performance than VNINDEX, the nearby support and resistance levels of the standout stocks above will serve as important reference points for the next trading session. Investors should closely monitor price reactions around support zones such as 22,950 VND for PVT, 77,000 VND for TRC, 12,389 VND for VTC, 28,600 VND for RTB, and 26,000 VND for HDP, while also watching for the potential to break through the corresponding resistance at 24,350 VND, 79,500 VND, 13,429 VND, 30,300 VND, and 28,700 VND.
From a technical standpoint, the dominant trend remains positive, but the market needs further liquidity confirmation to strengthen confidence in the current upward move.