
Market Session Overview
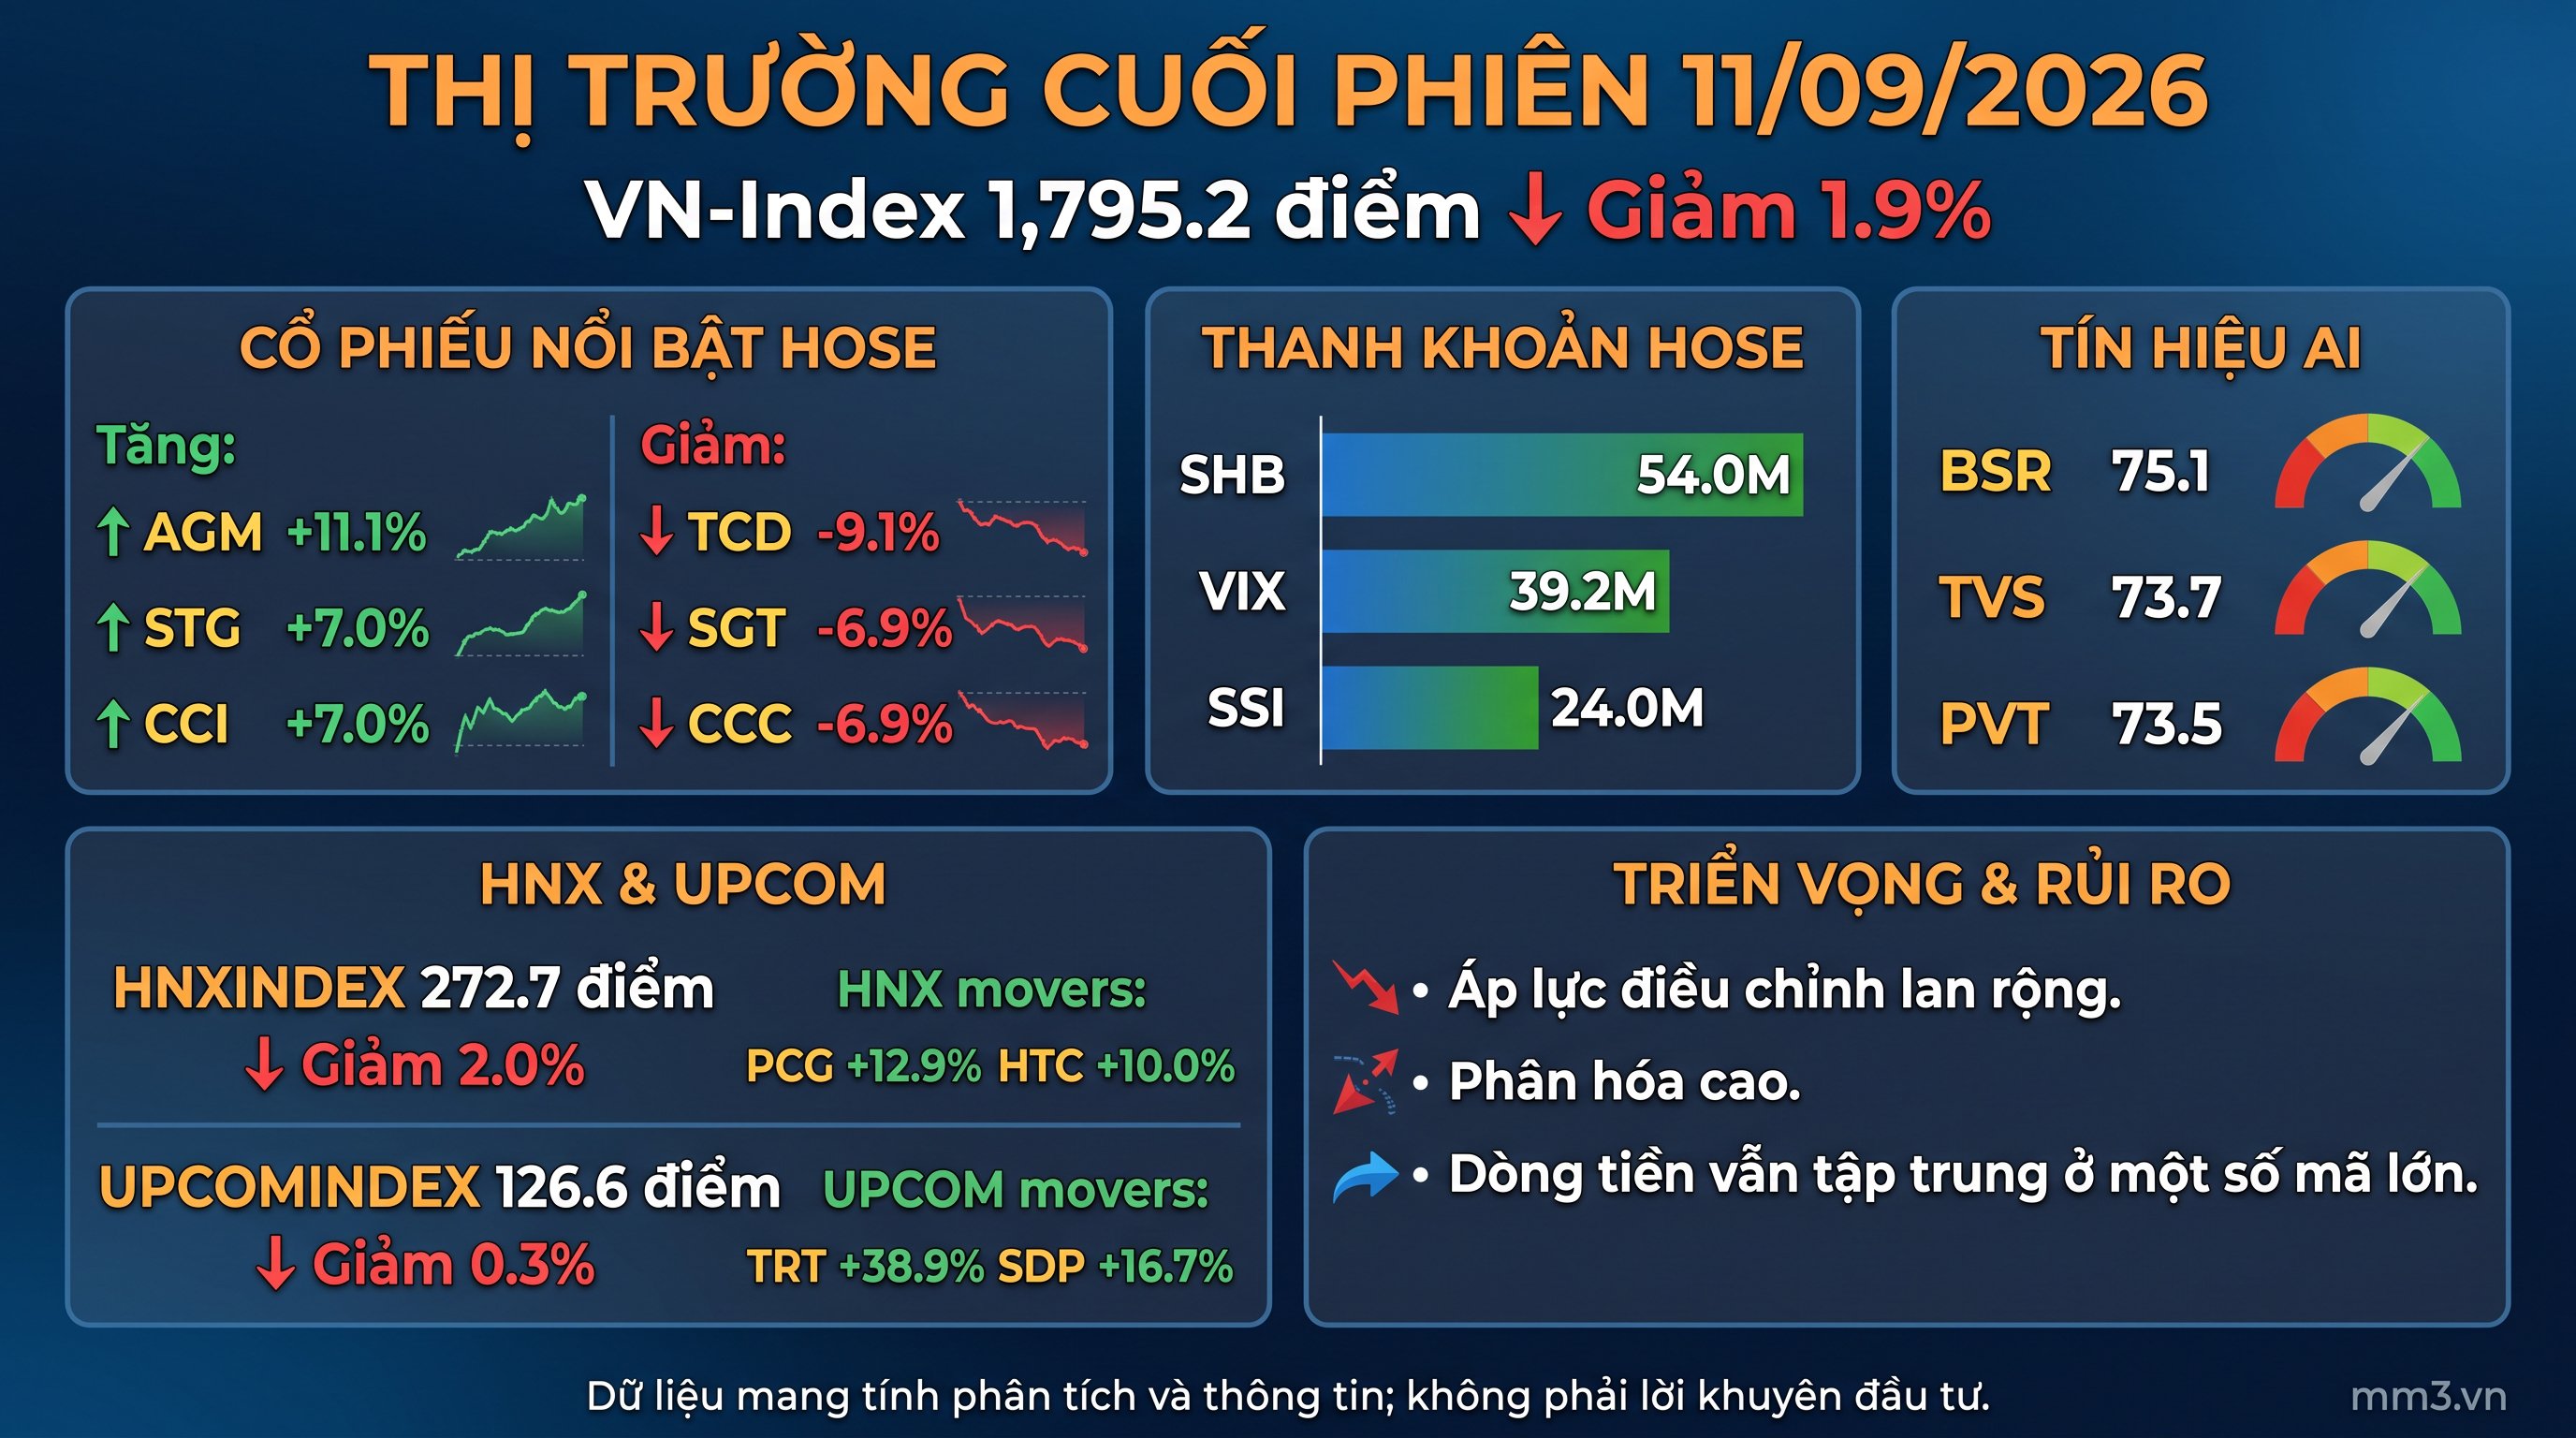
The September 11, 2026 session closed with widespread selling pressure as the VN-Index fell 34.0 points, or 1.9%, to 1,795.2 points. Total market liquidity reached 697.7 million shares, showing that cash flow remained active but was not enough to balance the market amid dominant red across the board.
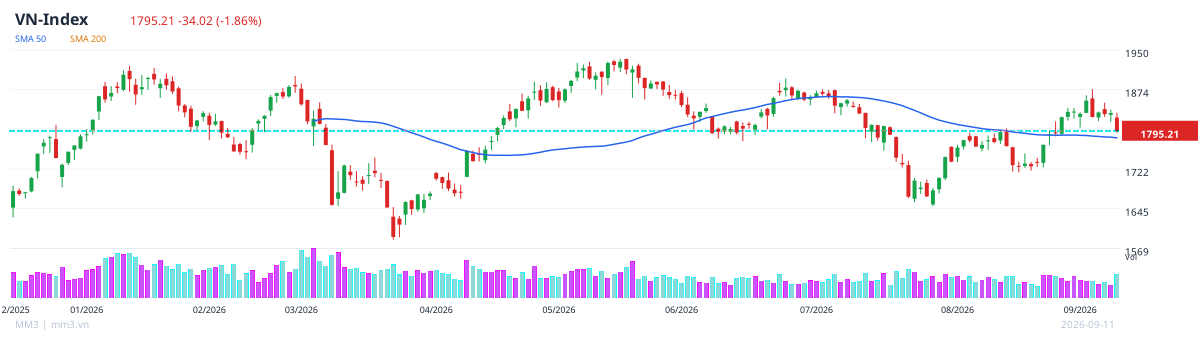
Market breadth tilted clearly toward declines, while some large-cap stocks and high-liquidity groups still attracted substantial trading. The movement suggests that cautious sentiment continued to prevail, especially as leading sectors recorded declines across many key stocks.
Notable Stocks
| Ticker | Change | Liquidity |
|---|---|---|
| AGM | +11.1% | 203,200 |
| STG | +7.0% | 1,600 |
| CCI | +7.0% | 3,400 |
| TCD | -9.1% | 1,602,000 |
| SGT | -6.9% | 61,300 |
| CCC | -6.9% | 2,600 |
On the upside, AGM, STG, and CCI were the most notable performers in the dataset provided. Conversely, TCD, SGT, and CCC faced heavier selling pressure than the broader market.
Sector Analysis
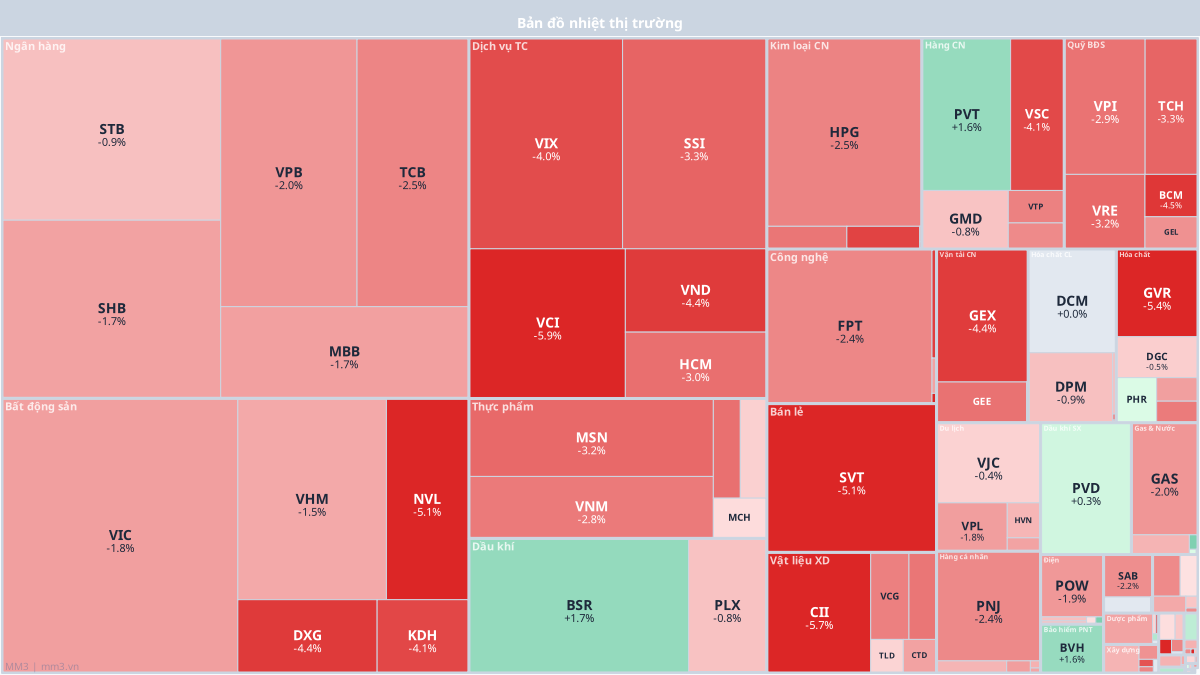
The banking, real estate, financial services, and construction materials sectors all declined simultaneously, reflecting fairly broad contagion pressure. Within banking, SHB, STB, VPB, TCB, and MBB all moved lower; in real estate, VIC, VHM, NVL, DXG, and KDH also were not spared from the correction trend.
Cash flow remained concentrated in a few high-liquidity stocks such as SHB with 54.0 million shares, VIX with 39.2 million, and SSI with 24.0 million. In the financial group, VIX, SSI, VCI, VND, and HCM all recorded selling pressure, indicating that the pullback was not limited to the index but spread to many blue-chip stocks.
Notable Technical Signals
| Ticker | Composite Score | Signal |
|---|---|---|
| BSR | 75.1 | RSI 49, MACD bullish, EMA bullish |
| TVS | 73.7 | RSI 74, MACD bullish, EMA bullish |
| PVT | 73.5 | RSI 67, MACD bullish, EMA bullish |
Technical signals continued to favor stocks with high composite scores, such as BSR, TVS, and PVT. However, these signals should be viewed against the backdrop of a weakening overall market, so the potential for short-term volatility remains significant.
HNX and UPCOM
The HNX-Index fell 5.7 points, or 2.0%, to 272.7 points; the UPCOM-Index declined 0.3 points, or 0.3%, to 126.6 points. On HNX, the most actively traded stocks included SHS with 13.4 million shares, CEO with 9.1 million, MBS with 6.0 million, and PVS with 5.6 million; notable gainers included PCG at +12.9% and HTC at +10.0%.
On UPCOM, the performance divergence is very strong, with TRT up 38.9% and SDP up 16.7%, while CFM fell 40.0% and FTI fell 32.4%, showing that volatility risk remains high. Although liquidity is still present in many stocks, the overall picture on these two exchanges has not yet shown a clear sign of balance.
Outlook and risks
In the short term, the psychological threshold around 1,800 points on the VN-Index is becoming a level to watch closely. If selling pressure continues to persist in the blue-chip groups, the market may still test lower support zones before forming a clearer recovery.
On the other hand, cash flow remains selective in some stocks with good technical signals and high liquidity, opening the possibility of stronger divergence in the coming sessions. Investors should keep monitoring developments in the banking, financial, and real estate sectors, as these remain the groups with the greatest influence on the overall trend.
The data is for analytical and informational purposes only and does not constitute investment advice.