
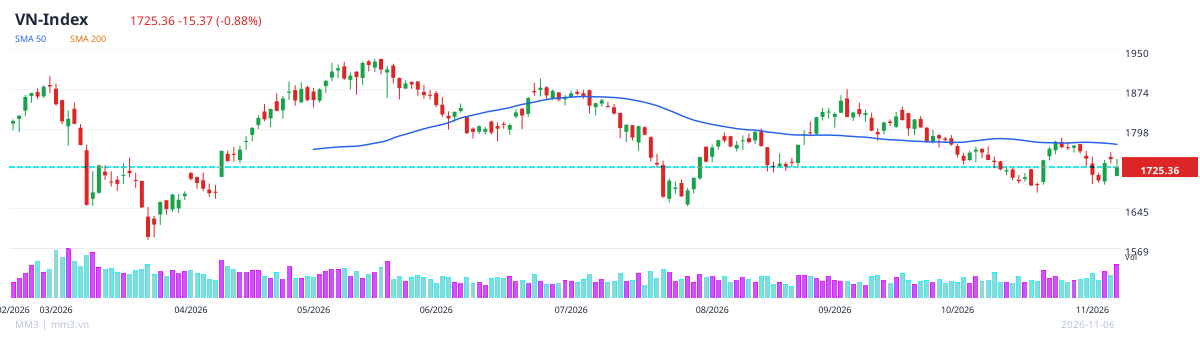
The market closed the 06/11/2026 session mixed. VN-Index fell 0.88% to 1,725.36 points; HNX-Index rose 0.05% to 256.73 points; UPCOM-Index fell 0.60% to 121.75 points. Trading volume reached 984,184,812 shares on HOSE, 80,606,333 on HNX and 35,043,686 on UPCOM. The data on the number of advancing, declining and unchanged stocks across all three exchanges recorded 0, so market breadth cannot be inferred from these indicators.
Session Overview
The divergent movements among the indices show a lack of consensus in the market. VN-Index dropped 15.4 points, while HNX-Index gained 0.1 points and UPCOM-Index lost 0.7 points. Price swings on UPCOM were notable, with GER up 38.8% and VGL down 40.0%.
Liquidity and Index Levels
| Exchange | Closing Index | Change | Volume |
|---|---|---|---|
| HOSE | VN-Index: 1,725.36 | -0.88% | 984,184,812 |
| HNX | HNX-Index: 256.73 | +0.05% | 80,606,333 |
| UPCOM | UPCOM-Index: 121.75 | -0.60% | 35,043,686 |
Standout volume was concentrated in VIX with 93.88 million shares on HOSE and SHS with 20.10 million shares on HNX. On UPCOM, BGE led liquidity with 3,027,700 shares.
Notable Stocks
On HOSE, PIT rose 6.99%, while YBM fell 7.00%. On HNX, TMB and VTH both gained 10.00%, while MCC and VNT both declined about 9.85%. On UPCOM, GER rose 38.82%, while VGL fell 40.00%.
Certain technical indicators for SJD, FDC, BTT, DTT and CTF showed RSI in neutral territory and MACD trending upward; EMA readings varied by stock. These are technical observations and do not replace data on price movements and liquidity.
Sector Analysis
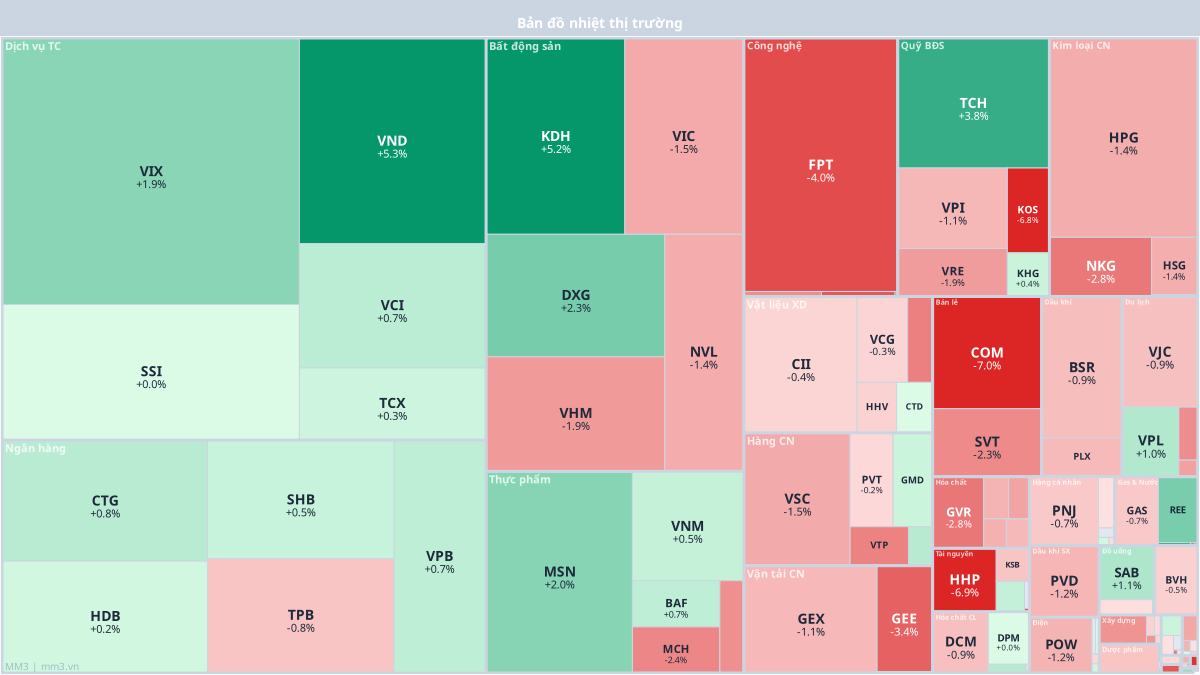
Performance across sector groups was uneven. In the technology group, FPT fell 3.97%. In real estate, KDH rose 5.23% and DXG rose 2.33%, while VIC fell 1.47% and VHM fell 1.90%. In financial services, VIX gained 1.91% and VND gained 5.28%.
The mixed movements within the same sectors show that divergence remains present. The chart below illustrates the market heatmap for the session.
Outlook
Data for the 06/11 session shows VN-Index closing at 1,725.36 points, HNX-Index at 256.73 points and UPCOM-Index at 121.75 points. These closing levels serve as a reference point for upcoming sessions. The data provided does not identify support or resistance levels or upcoming events, so no specific thresholds or catalysts can be determined. Large price swings in some stocks, particularly on UPCOM, continue to reflect divergence and volatility risk.
This content is for analytical and informational purposes only and does not constitute investment advice. See the full report at app.mm3.vn