
Trading Session Overview
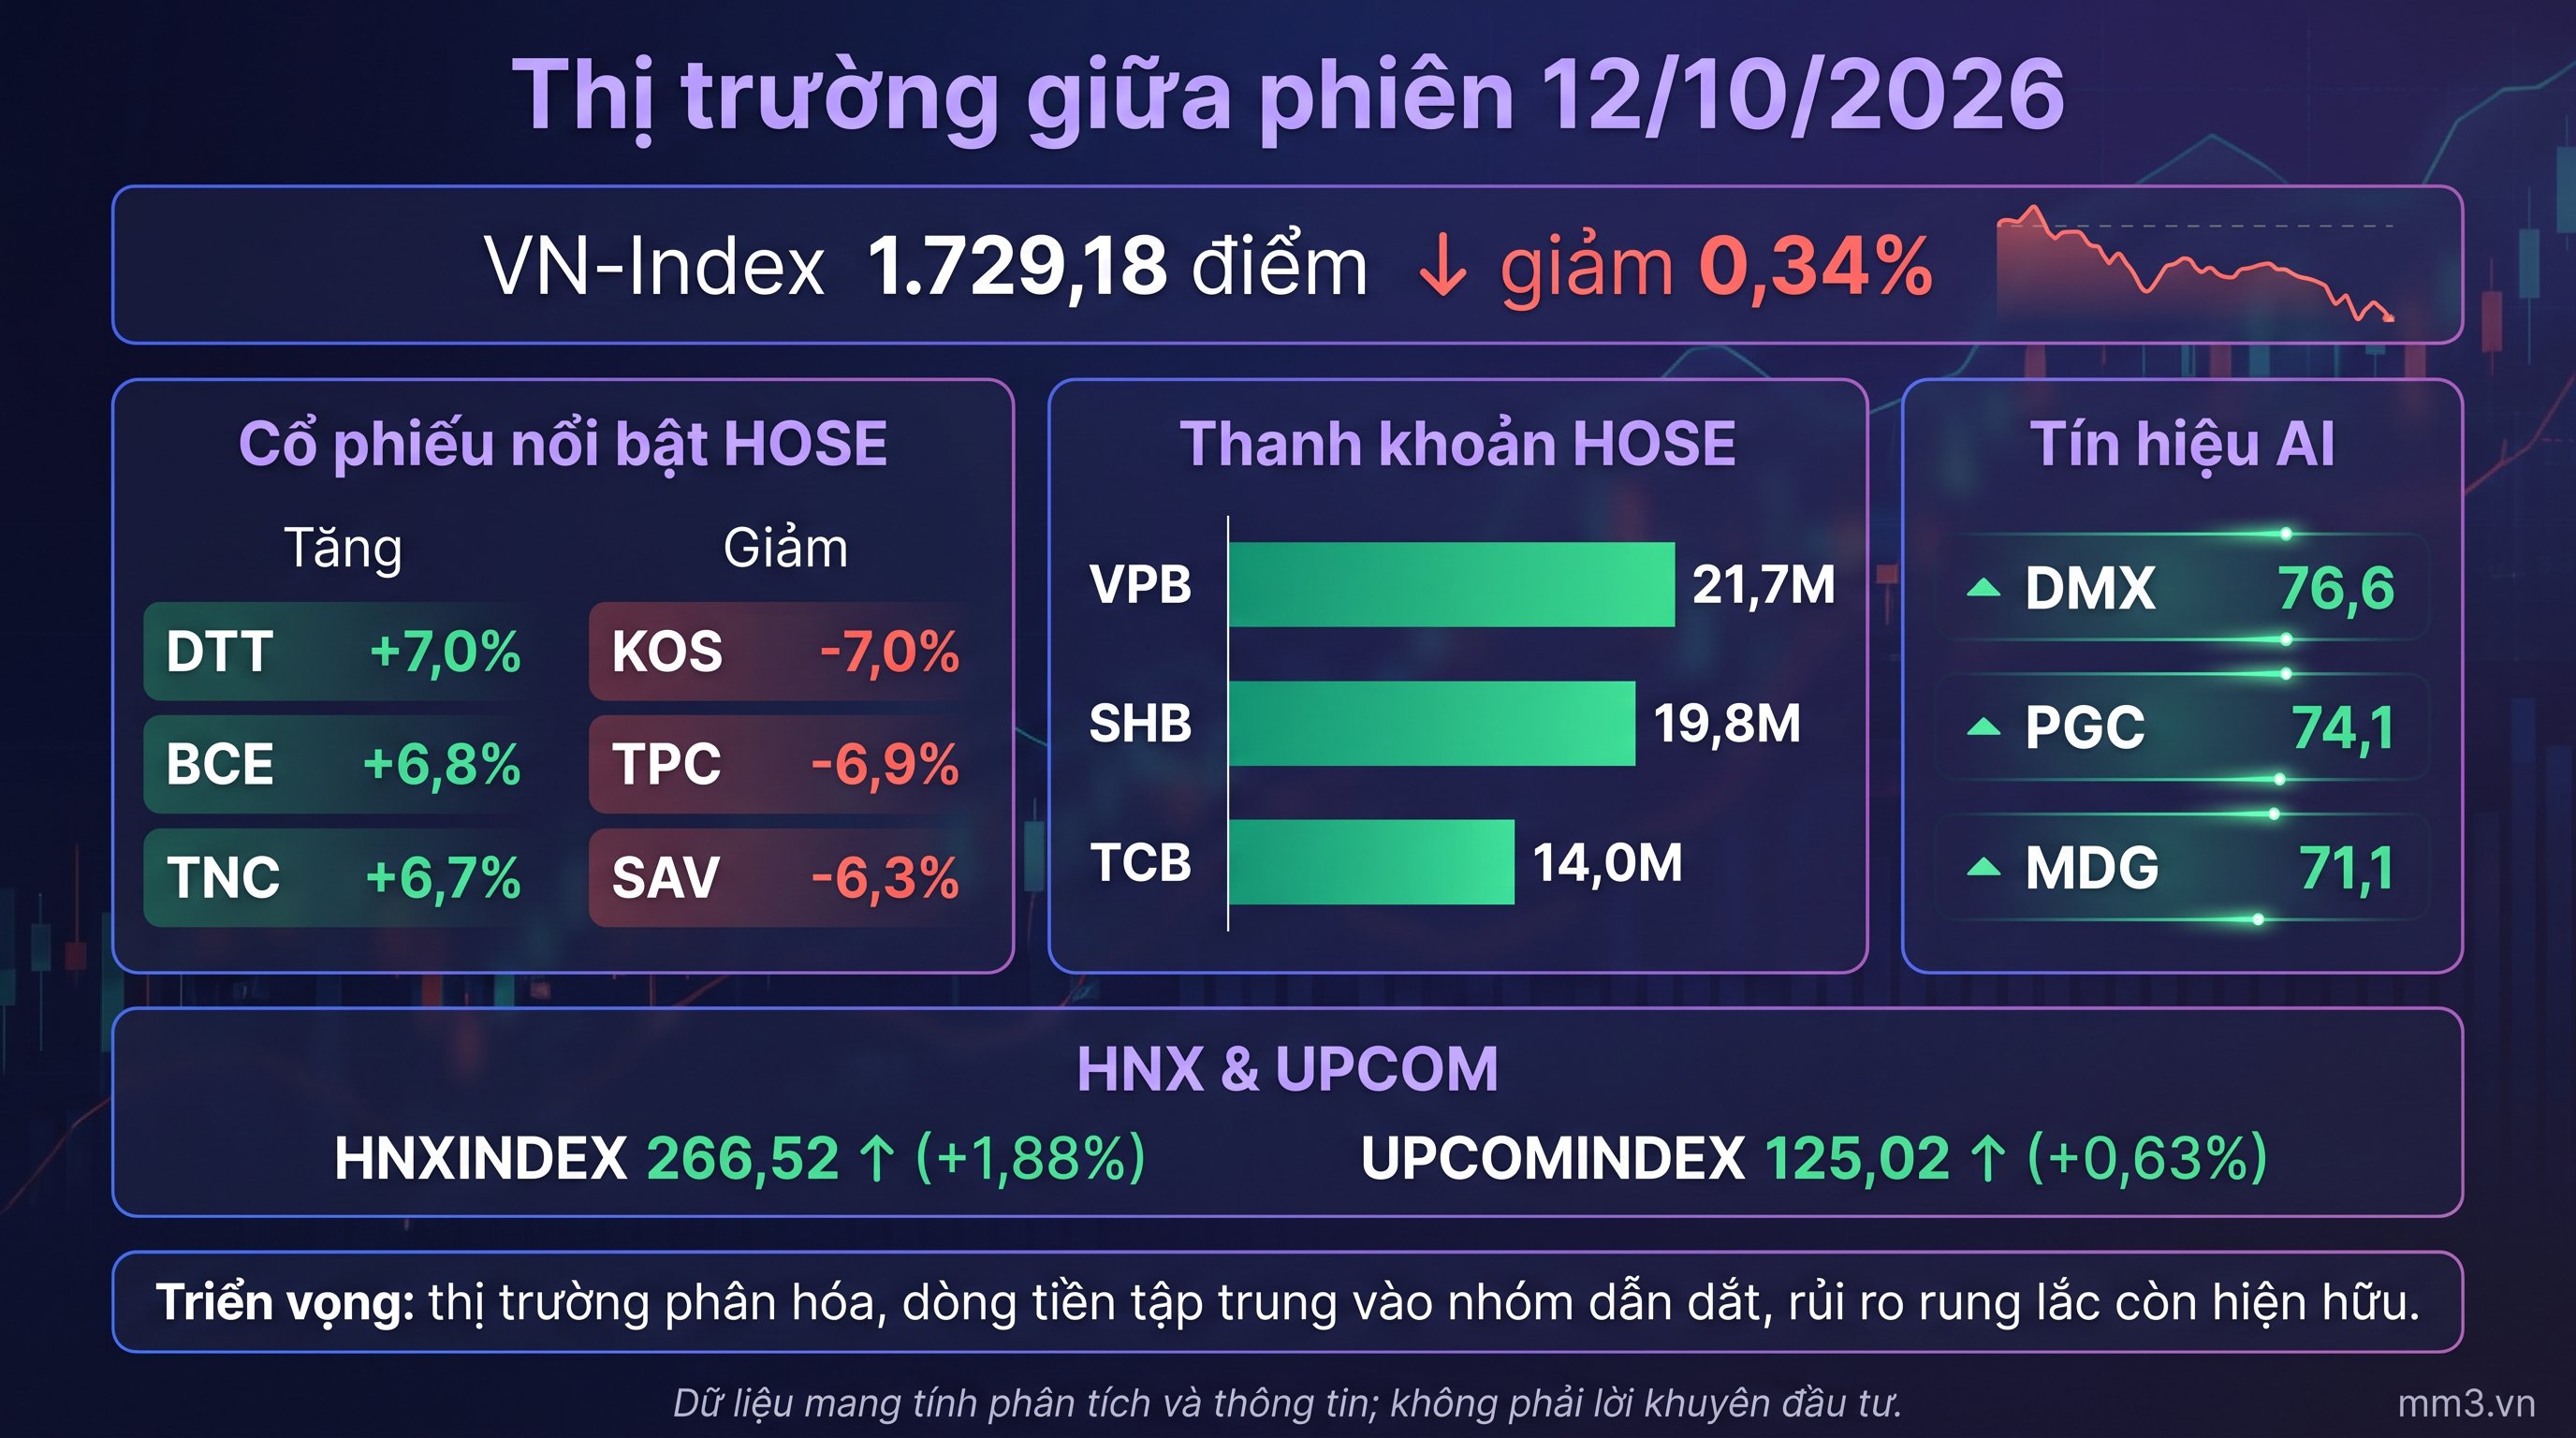
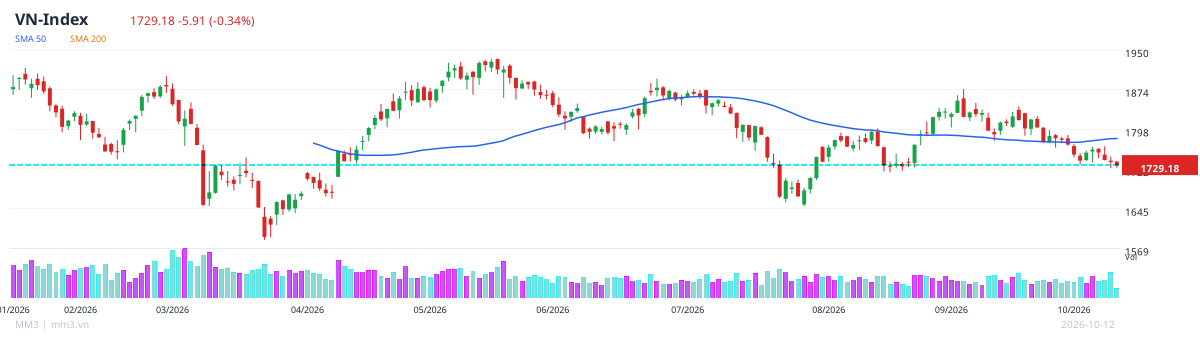
At midday on October 12, the VN-Index stood at 1,729.18 points, down 0.34%, reflecting a mild correction after a previous period of overheated gains. Liquidity on HOSE remained elevated, suggesting that money has not left the market but is rotating into stocks with their own individual stories.
Morning trading showed that divergence continued to widen. While some stocks rose sharply, many others faced significant profit-taking pressure, leaving the overall picture tilted toward selective trading rather than broad-based buying consensus.
Notable Stocks
On the gaining side, the standout performers were DTT (+7.0%), BCE (+6.8%), and TNC (+6.7%). These were the most prominent gainers among the leading stocks at midday, indicating that speculative capital remains active in certain hot spots.
Conversely, the declining side saw clear pressure on KOS (-7.0%), TPC (-6.9%), and SAV (-6.3%). The steep declines in these stocks show that short-term volatility remains high, particularly among shares that had already posted strong gains earlier.
| Ticker | Change |
|---|---|
| DTT | +7.0% |
| BCE | +6.8% |
| TNC | +6.7% |
| KOS | -7.0% |
| TPC | -6.9% |
| SAV | -6.3% |
Liquidity and Capital Flow
Trading liquidity was concentrated most heavily in the banking sector, led by VPB with 21.7 million shares matched, SHB with 19.8 million shares, and TCB with 14.0 million shares. This suggests capital still favors large-cap names, particularly those likely to drive the index in the short term.
Overall, high liquidity combined with divergent price action typically signals that the market is in a phase of capital rotation rather than a broad-based trend expansion. Investors are focusing more on the individual stories behind each stock rather than chasing the market as a whole.
| Ticker | Liquidity |
|---|---|
| VPB | 21.7 million shares |
| SHB | 19.8 million shares |
| TCB | 14.0 million shares |
Sector Analysis
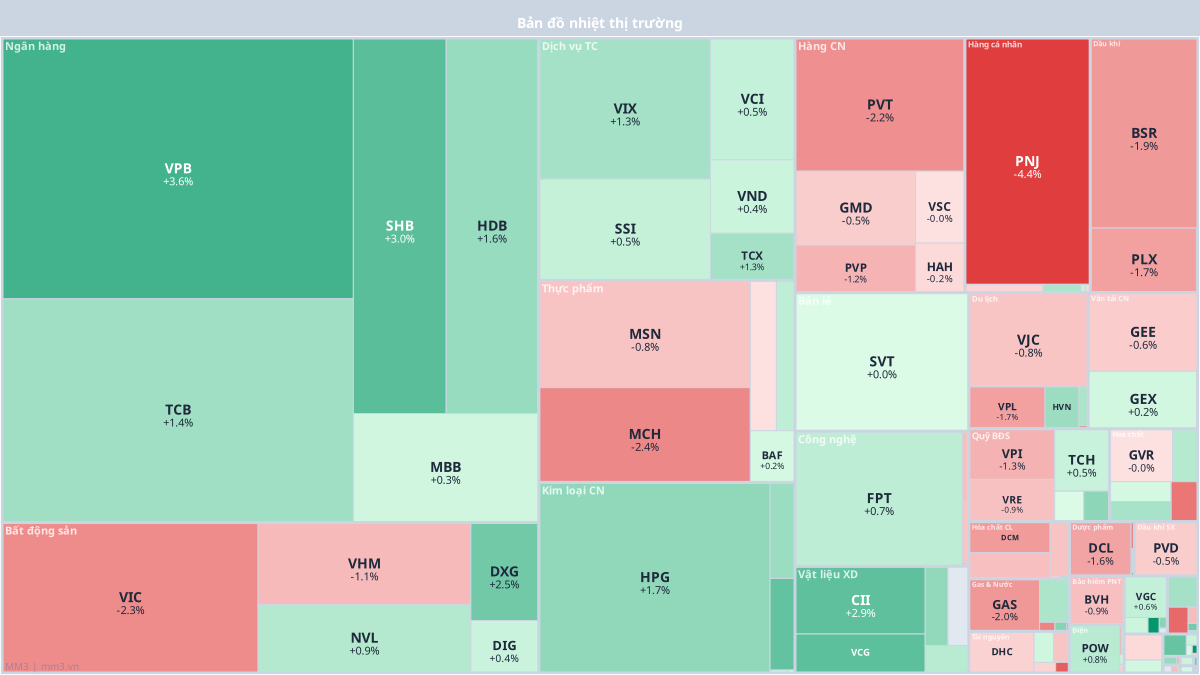
The banking sector continues to anchor liquidity, with VPB, SHB, and TCB leading in trading volume. Meanwhile, real estate and other highly speculative sectors continue to show strong divergence, with both ceiling-price gainers and deep decliners appearing within the same session.
From a broader perspective, the market has not yet formed a sustainable trend spreading across all sectors. Current developments are consistent with a rotation between large-cap groups and speculative names.
Notable Technical Signals
Several stocks are showing technical recovery signals worth monitoring, including DMX with a composite score of 76.6, PGC with 74.1, and MDG with 71.1. These stocks have indicators leaning more positive in the short term, but further confirmation from liquidity and trend durability is still needed.
Given the overall state of the index, the market is quite likely to keep trading within a narrow range if cash flow does not broaden into more sector groups. The nearby support level remains around the index's current psychological zone, while the resistance zone will depend on the ability to improve liquidity in the leading stocks.
Short-term Outlook
The most reasonable scenario for the rest of the session is that the market continues to diverge, with capital flowing into groups with high liquidity and stocks showing clearer technical signals. Volatility in the high-growth segment may still be significant, so close attention should be paid to pullbacks.
In this context, the deciding factor is not only the index level but also how widely liquidity spreads and the degree of consensus across sectors. If cash flow expands, the market will have a chance to consolidate its recovery momentum; otherwise, the divergence could persist for longer.
The data is for analytical and informational purposes only; it is not investment advice.