
Market Session Overview
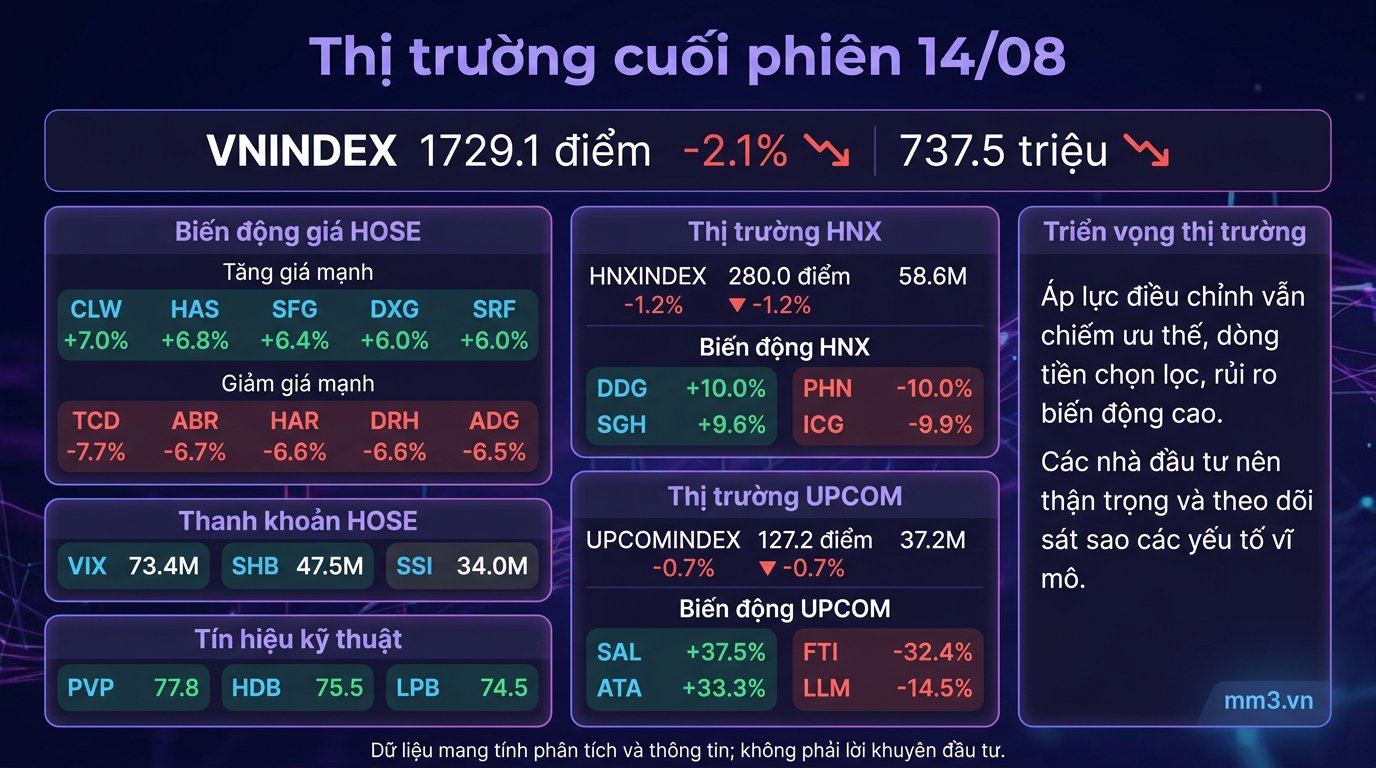
The August 14 trading session closed with broad correction pressure across all three exchanges. VNINDEX ended at 1,729.1 points, down 2.1%, on volume of 737.5 million units; HNXINDEX fell to 280.0 points, down 1.2%, with volume of 58.6 million; UPCOMINDEX declined 0.7% to 127.2 points, with volume of 37.2 million. Cash flow remained active but was largely selective, suggesting the market has not yet reached a clear consensus.
Market Breadth and Liquidity
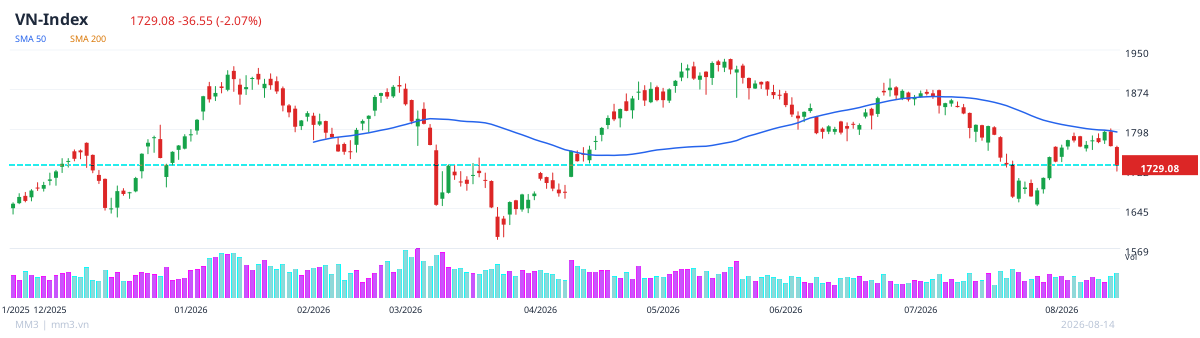
On HOSE, liquidity was concentrated in a handful of large-cap stocks and short-term money flows, reflecting clear selectivity among investors. On HNX and UPCOM, price fluctuation ranges remained wide, reinforcing the picture of elevated short-term volatility risk.
| Exchange | Index | Change | Volume |
|---|---|---|---|
| HOSE | VNINDEX | -2.1% | 737.5 million |
| HNX | HNXINDEX | -1.2% | 58.6 million |
| UPCOM | UPCOMINDEX | -0.7% | 37.2 million |
Notable Stock Groups
On the gainers' side, leading HOSE stocks included CLW (+7.0%), HAS (+6.8%), SFG (+6.4%), DXG (+6.0%) and SRF (+6.0%). On the decliners' side, notable names included TCD (-7.7%), ABR (-6.7%), HAR (-6.6%), DRH (-6.6%) and ADG (-6.5%).
This divergence suggests that money flow is still present, but favors individual stocks over broad sector-wide movements. This has increased short-term rotation and made individual stock volatility greater than the market average.
| Ticker | Change |
|---|---|
| CLW | +7.0% |
| HAS | +6.8% |
| SFG | +6.4% |
| TCD | -7.7% |
| ABR | -6.7% |
| HAR | -6.6% |
| DRH | -6.6% |
| ADG | -6.5% |
Sector Analysis
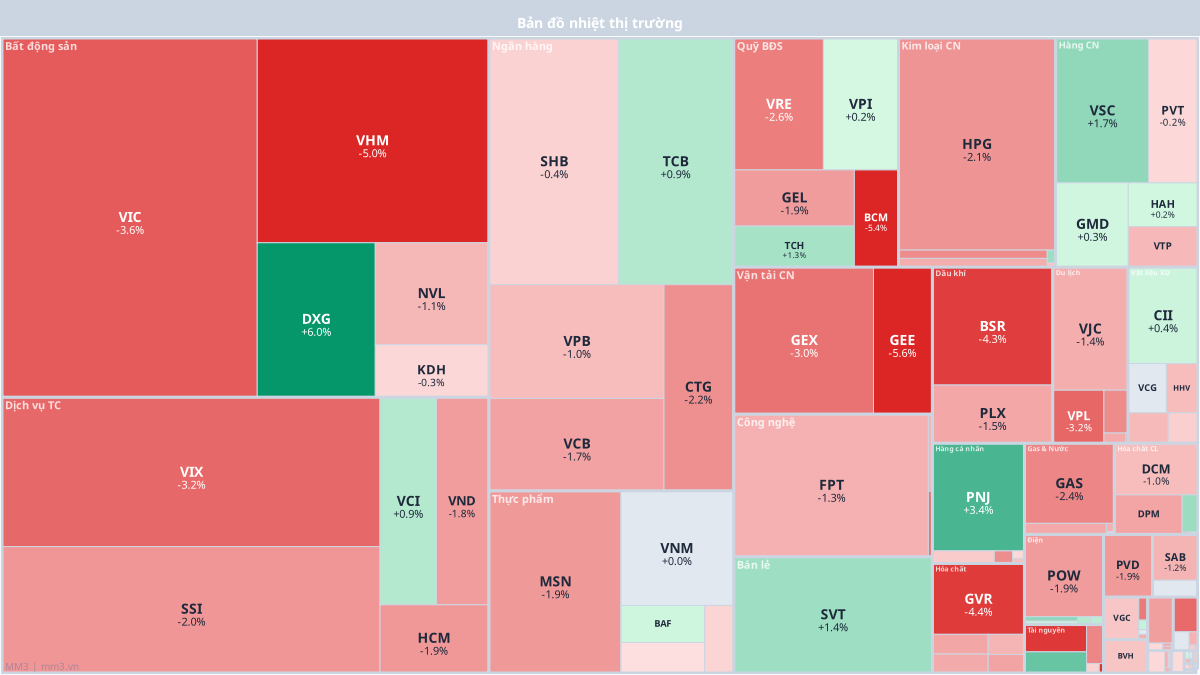
The financial services and real estate groups continued to show wide performance gaps between individual stocks. High liquidity in several key names indicates that trading momentum remains, but profit-taking pressure and stock-specific narratives are outweighing the broader trend.
Notable Technical Signals
Leading technical signal scores were posted by PVP with a composite score of 77.8, HDB at 75.5, LPB at 74.5, TRC at 73.6 and TVS at 71.7. These levels point to localized technical rebound opportunities, though not enough to form a synchronized uptrend across the broader market.
- PVP: 77.8
- HDB: 75.5
- LPB: 74.5
- TRC: 73.6
- TVS: 71.7
Outlook and Risks
The 1,730-point zone for VNINDEX is becoming a key short-term level to watch closely. If buying demand does not improve more clearly, choppy trading may persist in the coming sessions, especially while market breadth continues to lean toward divergence.
On the other hand, stocks with strong technical signals may still produce short-term rebounds, but the overall market has not yet shown enough improvement to establish a sustainable trend. Investors should watch how the index reacts at nearby support zones and liquidity levels in the coming sessions.