Overview of the trading session
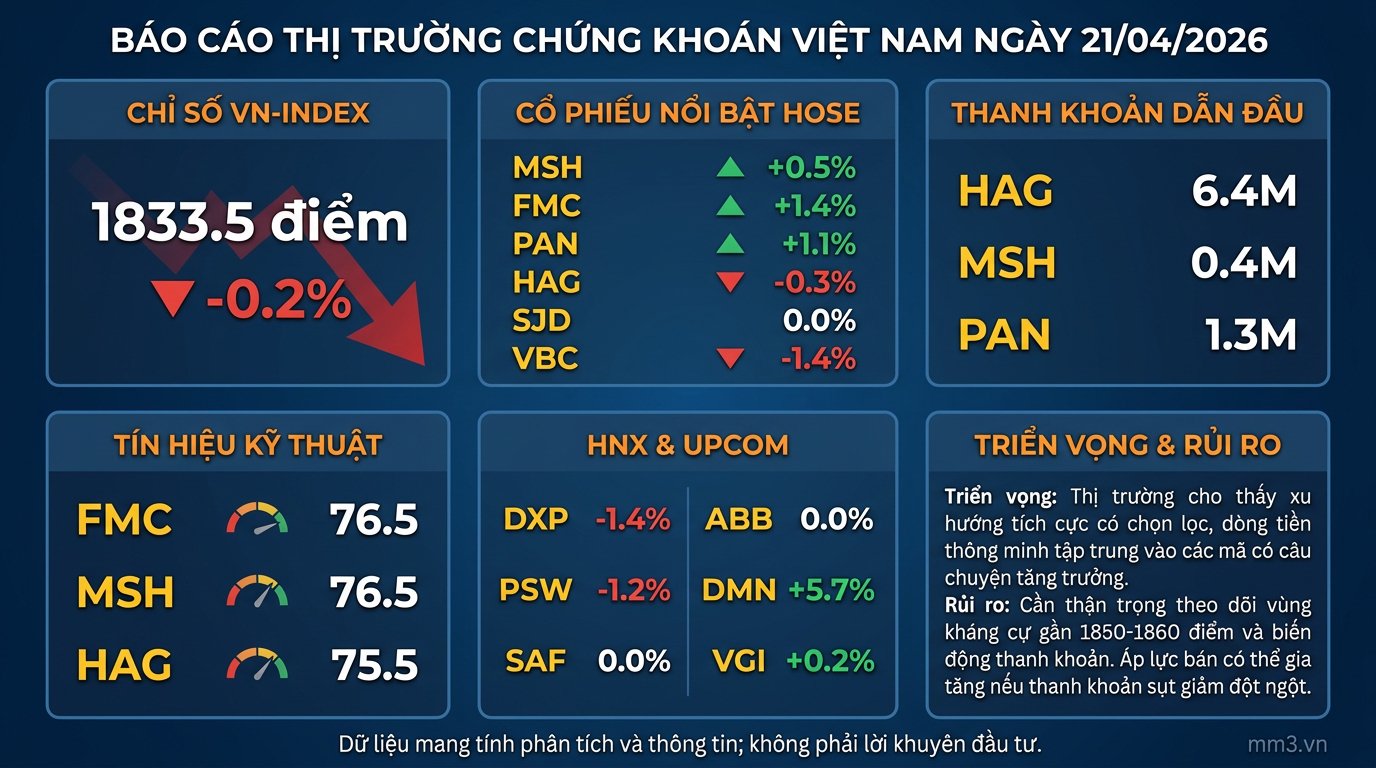
The trading session on April 21st showed a slight market correction, with the VNINDEX falling 3.6 points, or -0.2%, to 1833.5 points. Market liquidity remained significant, with trading volume on the VNINDEX reaching 866.6 million units, indicating that capital is still present but is becoming more selective.
Overall, many stocks maintain positive technical structures as the MACD , EMA , and PSAR indicators all show upward movement. However, most stocks are approaching nearby resistance levels, so short-term fluctuations and consolidation may continue.
Index trends
| Index | Score | Change | Mass |
|---|---|---|---|
| VNINDEX | 1833.5 | -0.2% | 866.6 million |
| HNXINDEX | 253.3 | -1.6% | 68.7 million |
| UPCOMINDEX | 129.2 | -0.2% | 48.6 million |
Outstanding stock group
In the gainers group, MSH rose 0.5% to 38,100 VND with significantly improved liquidity, while FMC increased 1.4% to 39,200 VND and PAN gained 1.1% to 32,650 VND. These stocks all maintained positive technical trends, with high composite scores and the nearby resistance zone acting as a crucial testing point.
Conversely, HAG edged down 0.3% to 16,350 VND, SJD remained unchanged at 14,000 VND, and VBC fell 1.4% to 21,500 VND. Among these, VBC is particularly noteworthy due to its PSAR (Post-Stock Arbitrage Ratio) shifting to a bearish state, very low liquidity, and weakened short-term trend reliability.
Notable Stocks
| Code | Floor | Price | Change | Liquidity | Overall score | Signal |
|---|---|---|---|---|---|---|
| MSH | HOSE | 38100 | +0.5% | 427600 | 76.5 | Positive |
| FMC | HOSE | 39200 | +1.4% | 55300 | 76.5 | Positive |
| PAN | HOSE | 32650 | +1.1% | 1322700 | 74.5 | Positive |
| HAG | HOSE | 16350 | -0.3% | 6362600 | 75.5 | Accumulation |
| SJD | HOSE | 14000 | 0.0% | 28900 | 74.4 | Passing by |
| VBC | HNX | 21500 | -1.4% | 100 | 75.7 | Caution |
Industry analysis and cash flow structure
Looking at the sector data, stocks with high composite scores still show better support than the overall market. DMN stands out with a 5.7% increase, even though liquidity hasn't really exploded; this is the kind of movement that usually follows a rapid increase followed by a need to retest the price base.
In the HNX and UPCOM groups, DXP fell 1.4%, PSW fell 1.2%, while SAF remained unchanged and VGI rose slightly by 0.2%. Notably, DMN and VGI maintained positive momentum, but these gains need further confirmation from liquidity and reaction at the near resistance level.
Key technical indicators
| Code | Floor | Overall score | Correlation of trends | Near resistance | Nearby support | Assessment |
|---|---|---|---|---|---|---|
| MSH | HOSE | 76.5 | Price increase | 38150 | 36500 | Resistance asymptotes |
| FMC | HOSE | 76.5 | Price increase | 39500 | 37900 | Good momentum |
| HAG | HOSE | 75.5 | Price increase | 16500 | 16350 | Narrow accumulation |
Short-term outlook
Overall, the market outlook remains selectively positive. Many stocks are maintaining upward trends, but the consensus hasn't fully broadened as the general index has retreated slightly and liquidity hasn't created a clear breakthrough.
In the short term, the nearest resistance zone for each stock will be the deciding factor, especially for stocks that have approached their technical targets such as MSH , FMC , PAN , and VGI . Investors should monitor price reactions at these nearby resistance levels along with trading volume in the following sessions to assess the potential for an extended upward trend or continued sideways consolidation.
This data is for analytical and informational purposes only; it is not investment advice.